This is my trading file to organise and jot down my take on the market .I do Technical Analysis. This blog is to keep track of my baby steps so that I can look back at my journey .Looking back tells me how far I have come from days when I knew nothing and can go further .It gives me motivation to keep going on even when I am tired. One has to back up trading with their own studies. The charts I post here are 99% inspired from Ilango sir.


Friday 30 December 2011

Dec 30 10:00 am

Today 's price movements tell me to buy ...
Reasons
1) ORB( 4657-4677) broken upside .
2) Prices have moved above HL ema ( 4662) DLema(4671) and WLema (4672) .
3) Prices above Pivot(4662).
4) Indicators in OS region . so a bounce is possible.
So Buying at 4676 with SL= days's low 4657.

Breakout of channel nifty is trading in , Sar to go long hit will further confirm the direction

Tuesday 27 December 2011

27th dec 3:00 pm

At 1 pm close , prices did close (4754)below the hour low ema (4763) and thus selling .

prices did go to 4723 low so 30 points gain till now Look at this set up of sma(s) and notice how  20 sma and 100 sma are now touching , if from this point if nifty falls making 20 sma fall( which was rising from last few days now) then this will be fast fall setup .

Another sell generated at 3:00 pm close when the 20 MA chart gave a sell signal to me .Prices move and close below the hour low ema . ( red line crosses the yellow line). 

I see Weekness

11:45 am
Prices have moved below Hour High ema at 4788 at 12 'oclock close let us see if it closses below this lvl .
Next is Dhema @ 4770 and then HLema @ 4766 developing is around 4769.
14 Rsi , Fast macd showing -ve divergence most of indicators at OB zone.

I will "SELL" if prices close below the hour low ema .

Thursday 22 December 2011

EOD 22 Dec.2011

Prices :


MHema 5321      
  WHema 4941  
  DHema 4726  
  HHema 4712
  HLema 4675
  DLema 4619  
  WLema 4689  
MLema 4732      


I see that All the high ema s are lined up in decending order . Low ema are all shuffled up .

As Hour Low ema has moved above the Day low ema I see that Hour trend is UP and its very close to being more that Week low ema . As that happens weekly the trend will be UP . The direction is UP.
 Monthly and weekly low emas are lined up alright .
For now I can say if the Green box continues to go above purple and blue the trend will be UP.
I will follow this everyday to see if I can derive something out of it .

Moving average Band


Above chart is 20 hour high and low band plotted n hourly chart with 5 and 10 MAs .
A buy signal is generated, As we can see here the signal line ( Red ) crossed the lower band(yellow) at about 4590 lvl and also at the same lvl  5 ma crossed 10 ma (Green) . 
At present is confortably placed well above 10 ma as a trailing stop loss we can keep a watch when 5 ma again crosses the 10 ma.Nifty has already travelled ~130 points after the signal was generated .

Trendline / Channels

The Slow macd has crossed the 0 line and moved up , indicating prices to go up .
Prices have broken the channel as well and now trading outside it.
There is +ve Divergence as well present in the chart .


Tuesday 20 December 2011

Update at 2:30

Morning trade the stop loss was hit at 4594 and no profit no loss "capital preserved".

4555 an important support now , If we go below 4555 then we will be in iii rd wave of 'C' down .
ii look like a flat so it will get over around 4620 lvls .

20-Dec-2011

Update 12:15 All the short term MAs have converged at 4597 ...so keeping the SL at 4594 now to preserve the capital .

-------------------------------------------------------------------------------------

WHema
4901
DHema4768
WLema4697
DLema4659
HHema4619
HLema4585
Buying at Hlow ema for 1st target hhigh ema then dlema ( For Intraday Only) As Day wise the Trend is down till prices close above DLema .


Date PositionSizeEntrySl1st Lot exit2nd Lot ExitExitP/L
20-Dec-11Buy5045904580

Monday 19 December 2011

19th Dec

The Fast Fall did materialise today morning and Nifty fell to 4556 .
I see +ve divergence in 9 Rsi  chart (above) but this divergence is there for last 3-4 days .
There is a bounce coming soon ..when ?

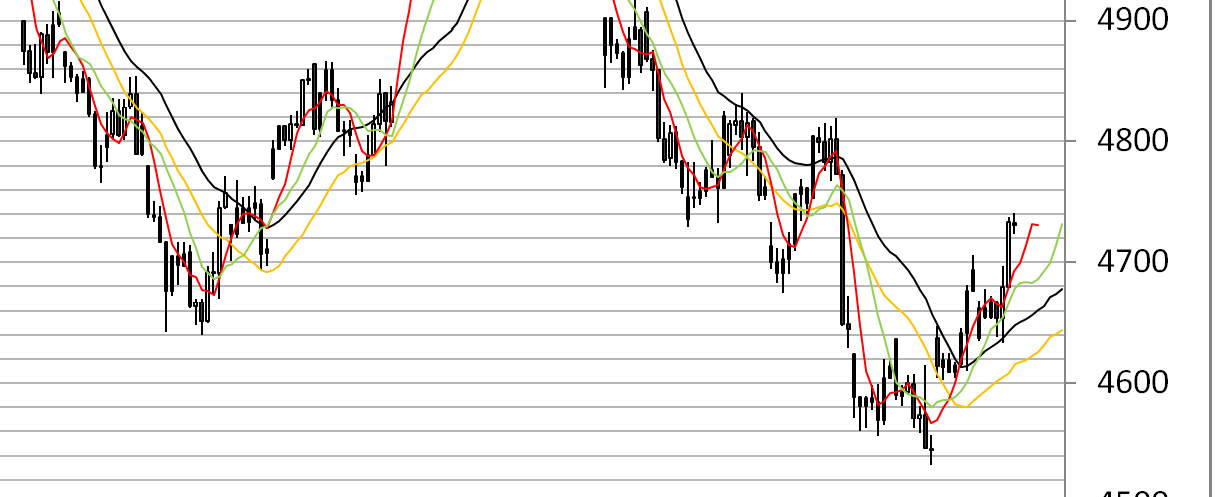
As the 5 sma moves above 10 sma as seen in the chart , it has made me come out of my short position  .

As far as Moving average channel is considered , I will wait for the red signal line here to cross over the yellow line for a buy signal.

I will wait for a good set up before taking any other positions .
Hour high ema at 4618 presently ,
As prices above hour low ema at 4576 they indicated a buy and as prices close above Hour high ema at 4618 then it will be buy and hold .
Price currently  very close to day high at 4623 if they close above 4600 , it will give a very small body with gap down on day chart .
and If we open Gap up tomorow , then Morning star may be in the making .
Day low ema at 4659 , prices crossing this lvl and closing above it  will generate a "buy" signal for me .
Prices moving below 4575 and closing , generate a "sell" for me.

Elliott Wave.

Long term chart                                                           Weekly Nifty chart .

There are 2 possibilities presently . We are in wave C to down in 5 waves out of which i , ii done ii going on iv and v to follow  .
Let me put it here again
A- 5400-4639 =761
    B- 4639-5099 = 460
    C is on (Down) in 5 waves , Expectation = A = 761 which comes to 4338 !!!!!!
           1   5099-4728 =371
           2   was a irregular flat , whose wave c could not do the expected that is above wave b so effects could be very implusive wave 3 ...I guess which we saw today.
      so 2 = 90
             a-4728-4839
             b-4839-4673
             c-4673-4818 ( fell short of expectation which was above 4839 atleast)
Now 3 going on in 5 waves min target = 1 = 371 which comes to 4447
 we touched 4556 (19 dec)
The other possibility ( In RED) is that we are almost finishing b.B and will start c.B soon ( This B is a irregular flat where in b.B went below the start of a.b) so possibilities of c.B touching lvls higher than high of b.B ( 5099).


Friday 16 December 2011

MA Channel Setting

As I was backtesting I see lots of whipsaws and small profits when I plot 5 high and 5 low channel . Plotting 20 High and 20 Low ema/sma with 5 period as the signal line lets you stay  in the trade for longer time and wipsaws are less though there are wipsaw there as well . One can fine tune it with plotting 10 period MA as well on the same chart and Part booking at 5 and 10 MA crossover.I will try to follow this for some time.Have a look

What a Fall!!

OMG !! what a fall

So covering at 4782 was really good .
Look at the channels now.

Going short below
 first below hour low ema and then below day low ema would have been great , but I did not do that .
Currently nifty has broken the Low at 4639 and touched 4628 today , very bearish sceen as seen by me .

On the Higher counts I am counting as
ABC zigzag from 5400
    A- 5400-4639 =761
    B- 4639-5099 = 460
    C is on (Down) in 5 waves , Expectation = A = 761 which comes to 4338 !!!!!!
           1   5099-4728 =371
           2   was a irregular flat , whose wave c could not do the expected that is above wave b so effects could be very implusive wave 3 ...I guess which we saw today.
      so 2 = 90
             a-4728-4839
             b-4839-4673
             c-4673-4818 ( fell short of expectation which was above 4839 atleast)
Now 3 going on in 5 waves min target = 1 = 371 which comes to 4447
 we touched 4628 today 16th dec.
I think i is done of this 3 as
           i- 4818-4628=190  
          ii-4628-4671* is going on
         Retracement lvls for this corrective wave can be
         23.6%(4673) Almost done today
         38.2%(4701)
         50%(4723)
         61.8%(4745)Golden ratio
         78.6%(4777)
Lets see what Monday brings.

Divergence 
A good +ve divergence is also seen in 9 rsi hour chart .
I can see fast fall as well here with 7 and 34 Sma .

Intraday update1

update at 1:00
5 ema did not cross 10 ema . Now that nifty bounced back Lets see if exiting the trade was a good move , or paitiently waiting for 5 ema to cross 10 would have giving higher gains .
---------------------------------------------------------------------------------------
at 12:30
My obervation is if I wait for 5 ema to cross below the 10 ema for exit I am lossing a few points , compared to if I exit on a close below 5 ema . ( 5 min or 15 min candle)
As we entered this position at 4745 looking at the Hour MA channel , exit looking at Min candle can be more appropriate.
This is what I think at present . More observation is reqd to say it with more confidence.

So saying that , currently Trailing SL of 4886 hits as Nifty spot goes below it .
I could have exited in various ways lets see which gives max gains.
  1. The 5 min candle at 11:55 did close (4782) below the 5 ema then @ 4786 ...so close position at 4782 .
  2. The 15 min candle at 12:00 did close (4779) below the 5 ema 4786 ...so close position at 4779.
  3. Wait for 5 ema to cross below 10 ema.
  4. As the trigger line (yellow ) comes back in the channel below 5 hour high ema . accordingly close position at 4782 .
Lets see which one is most beneficial .

Presently closed position at 4782 .


Date PositionSizeEntrySlPart/BookingExitP/L
15-Dec-11Buy10047454700
16-Dec-1150479550
50
4782
37
+87


Update on yesterdays Long.

Carrying the trade table ahead

Date PositionSizeEntrySlPart/BookingExitP/L
15-Dec-11Buy10047454700
16-Dec-1150479550

I will carry the the 2nd lot till the 5 ema is above 10 ema (Black Line) .

Thursday 15 December 2011

15/12 observation

Yet another +ve divergence seen in hourly charts , with 14 RSI  Also nifty at the upper band of the channel . Moving average channels ( 5hour high , 5 hour Low) has again given a buy today at 2 'oclock close .
at 4840-4850 lvls . Stop loss at close below 5 Hour low.

Let me maintain a trade table for MA Hour channel .


Date PositionSizeEntrySlExitP/L
15-Dec-11Buy10047454700  


Wednesday 14 December 2011

EOD 14/12 Larger Trend

Monthly trend is down . Weekly it is down and daily it is down . Yesterday hour frame did turn up , but again looking at today's last 2 hours , it seems to be trying to allign with the larger trend . Down .

Moving average channel in hour frame triggered abuy towads the end of day yesterday and today again it is reversing direction and triggered a sell with the 3 hour close candle.
 Now if we look at the channels in daily time frame , we see that the sell triggered close to 5400 is still on ,

Todays action provided another oppertunity to enter the short trade as the hour prices broke below the 5 hour low ema .
Also the Zero line reversal is coming to mind , when the macd line starts to reverse just after touching zero line it is very bearish and vise versa .
As we see here in the above chart , macd line reached zero line and reversed again . lets see the action tomorow .
Since the trend in the higher TF is down , hourly bouces can be used to sell .

Tuesday 13 December 2011

Outlook for 14.12


As we see in the above chart , the MA bands suggested a buy towards the end of the day As the Pink signal line crossed above the 5 High ema ,and  the rally from 4730 lvls to 4820+ lvls.
In the EOD chart below the signal is not yet triggered. Tomorrow as the prices move above the low ema presently at 4810 lvls  one can looking at hourly charts also , look for a good entry to buy.

+ve Divergence was seen , in Hour chart with 9 Rsi , 14 Rsi , Fast macd today and the rally followed it .
9 Rsi moved from below 20 mark above it .

Fast Macd is yet to trigger the buy signal , I am keeping an eye on the signal line , it is very close to 0 line ,if you see it is just below it.As signal line crosses the 0 line it is considered bullish.Let us see if it crosses tomorow.
Fast Stochastic is poised as if it is just about to cross the signal line , yet another thing to keep an eye on .

Emas have a bearish allignment . Shorter term emas are lying lower than their higher term emas .
What I understand is if we see upside direction tomorw then it will confirm the MA cross over , also will support the +ve divergence and macd signal line will do zero crossover.