This is my trading file to organise and jot down my take on the market .I do Technical Analysis. This blog is to keep track of my baby steps so that I can look back at my journey .Looking back tells me how far I have come from days when I knew nothing and can go further .It gives me motivation to keep going on even when I am tired. One has to back up trading with their own studies. The charts I post here are 99% inspired from Ilango sir.


Friday 28 September 2012

1/10/2012

Price wise , unless we close first below 5699 ( HLema ) , no momentum in hour trend which is down presently .

Day trend is up with momentum with a close above 5696( DHema ).

Week Trend stays up and so is the month .

Shorts only when , we close below the hour low ema with a 5-10 -ve crossover . Hour charts showing -ve divergence with peaks 5720 and 5735.
confirmation comes with a close below 5565 is Day ema , weakness only below this .

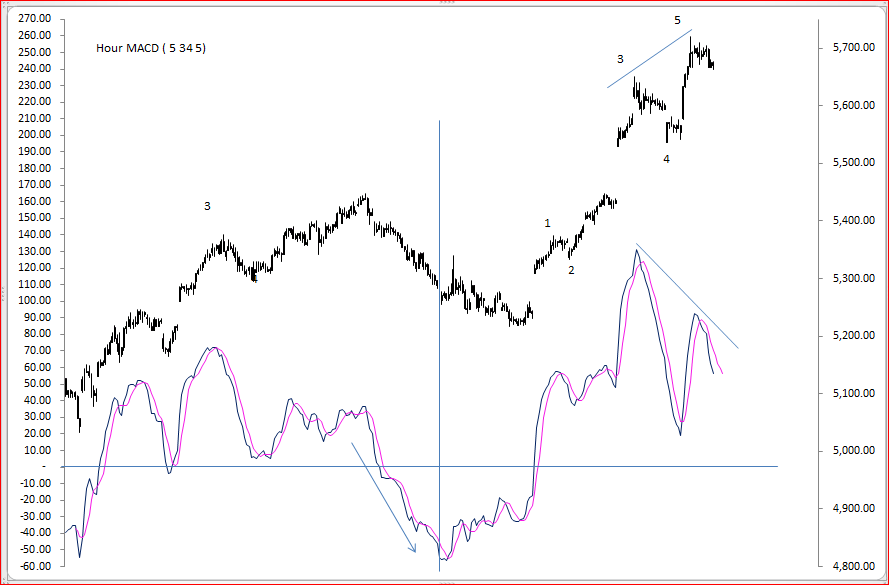
EW wise , I feel we have done 5 waves at 5720 and are in an irregular correction presently , with 'b' shooting over 5 today at 5735. We will see a 'c' wave if we are in irregular flat from 5720 , which should take us below 5638 . Indication of this possibility will come , with weakness in price as stated above.

Divergence : Hour charts showing -ve divergence with peaks 5720 and 5735.

Indicators :

macd ( 34 5 5) on hour TF has given a sell today . Candle pattern wise , there  is a stooting star today .

Indicators , EW , Candle pattern , developing -ve divergence on hour charts.showing bearish possibility  , But the prices are firm and are not showing any weakness in Day TF , Though they are down in hour TF , but are closing above Hour low ema . The min requirement is to close below the HLema which is presently at 5699.

Tuesday 25 September 2012

26/9/2012

Day chart has a Doji today , Whole day it was range bound , I did short the market today as prices closed below Hour Low ema , at 12 noon . But then they decided to take support at 5655-5650 zone and bounced . SL was channel top which was first around 5695 and which slowly moved down , Finally there was Dip to 5666 during the last hour and I closed my position there with a loss of 7 points , Phew !!

Did not carry any positions as a corrective is going on ..and moreover I am not available tommorow .

What do the charts say to Me , here it is ...
We  are in corrective move presently ,
Now Q is whether we are correcting the move from

5216 to 5720 ( 5 waves over at 5720) or move from 5333 to 5720 ( assuming only 3 waves done at 5720 and one more top above 5720 as 5th wave )  ...lets look at the Fib retracements ...

If it is correction for 5216 to 5720 then this present correction should me more than what 2 and 4 have done


So more than 113 comes to below 5607 and the path can take form of a Flat , zz or a triangle.
Fib ret can be seen in the table below .


 From   To   Fall/ Rise  0.236%        0.38                 0.50 0.618% 0.736% 0.80%
5537 5720      (183)    5,677    5,650             5,629    5,607      5,585      5,574
5333 5720      (387)    5,629    5,573             5,527    5,481      5,435      5,410
              -             -             -                     -             -             -             -  
5216 5720      (504)    5,601    5,528             5,468    5,408      5,349      5,317


 And as per option 2 if only 3 waves are done at 5720 then we are correcting the 3rd wave which started form 5333.Again since this is correcting the whole move from 5333 , then the correction should be more than subwave ii and iv which again comes to below 5607.


Price wise we have closed above 5 Dema at 5637 and Also above 5 D hema at 5666 , so day trend is up with momentum .
Hour trend is facing correction  , but have closed above Hlema at 5667 . So hour trend down without momentum .
 Price wise no weakness .
BUT
-ve divergence still there in hour charts , with macd ( 34 5 5) in sell mode . This sell will negate if this macd shows a +ve crossover.
5 sma and 20 sma are poised interestingly ,  it may give a Fast rise / Fast fall .


Have a nice day !
 

Monday 24 September 2012

25th Sep 2012

We closed at 5669.6

Hour trend down with a close below hour 5 ema ( 5677) , hour low ema at 5669 , a close below this would bring down momentum in hour TF  .

Day high ema at 5648 5 day ema far below at 5618

-ve divergence prominent on hour charts ...with a sell triggered today with a cross over of macd ( 34 5 5). But again , Day high ema is at 5648 unless we close atleast below that ,this is just a correction IMHO.


Still vth of 5th pending . lets see if that comes next trading session , or more weakness

Friday 21 September 2012

Ganpati Bappa Morya!


Posted by Picasa

EOD 21 sep

Hour trend is up  with momentum .

I see a -ve divergence in hour charts as well .


When we see the 5th wave fractals From low of 5534, one last leg ( 5th of 5th ) seems to be remaining . Did short during the day , but then closed the position with 20 points loss today itself . Wanted to carry the position , looking at
 channel top , Hour TA being OB as well as Day TA,   -ve divergence and a pin bar candle on hour charts at 1 but did not have courage to carry the position .Will wait for Monday open , If we go higher than 5720 , with -ve divergence in 5 mins charts then will short again , while mainting the divergence in hour charts  .


Monday 17 September 2012

Tata Motors


17th Sep , Shooting star after an uptrend with good vols , so next day a down candle confirms the
pattern .Then a down move .

Also a DT at 283 . Prices right at 61.8 %  .

My Take : If we get a down candle 18th Sep , then a good opportunity to short.
 

18/9/2012

There is a -ve divergence seen in day charts as below , with the tops at 5631 and 5650


During the day , hour Macd ( 34 5 5) gave a sell signal as seen in the chart below .
 

We have closed below HHema , so Hour charts are showing weakness along with a sell that Macd ( 34 5 5)  gave .
Day Trend still up , All these gap ups have made the prices come far away from Day ema at 5507 .

On Auspicious occasion of Ganesh Chaturthi I will be little busy with other things so updates will not be regular in coming days .
 

Friday 14 September 2012

EW from 6339

From high of 6339


From the high of 6339 we did WXY at 4531
 
 From 4531 ,
 First we have to see this wave from 4531 as a 3 or 5 wave ....It does not look like a 5 wave , but its impulsive nature makes me believe that it is a 5 wave .
 so here is the chart


Thursday 13 September 2012

14/9/2012

First thing that comes to my mind is ,

Did we do a double top today at 5448 ?

Closed below HHema , with Hour TA in OB zone . indicates a pause for sure , will it get converted into correction ?? We will know if we get a close below 5Ema on hour TF ( 5433) and then a close below HLema ( 5426) .

Hour charts are showing weakness , MACD ( 34 5 5) has triggered a sell . also slow macd and fast macd presently below the trigger line .
But on hour charts SS is still above 80 mark . This has to come down that lvl if any downmove

50 MA has given a bullish cross on hour charts with 100 and 200 MA .

On day charts we have a Doji right on the blue TL , indicating indicision ...But weakness on day charts only with a close below 5401 DHema .IF we close above this blue TL then next resistance would be the Red TL and also the possibility of being in 'e'.


Day charts are developing a divergence as seen below,


All in all , Hour charts showing weakness but no weakness in day charts . Giving importance to higher TF untill we close below Hour low ema or Day high ema , we are still going UP.
 
Important announcements tonight , I am biased towards a bearish view. 


Wednesday 12 September 2012

13/9/2012

-ve divergence is  invalidated in the hour charts Macd (  34 5  5 ).
14 rsi and fast macd still showing the divergence .


Clear strength seen in hour charts , day charts , week charts and month charts. .

Trending Up with momentum in all TFs
  .
5448 last top , and 5430-5450  major resistance ahead , lets see how prices behave around that level .

Today's closing also bullish , closed almost at day high 5431.

When indicators are at extreme reading ,then watch out for ORB ,it is a good guide .Hour TA is OB ,I will keep a watch on ORB, day TA started to form a -ve divergence. Keeping a watch on Macd(34 5 5) , divergence and orb

Also 5458 is 80% of fall from 5630 to 4770 .
 

Tuesday 11 September 2012

12/9/2012

Sir says ,

During an uptrend , gap downs are good points to enter longs , this is not a rule but a guideline and how true it held today ,
ORB helps in this method .
We are trending up and there was gap down till close ema or low ema  , which could have used to enter long .
ORB broke upside , and that is a good confirmation for the trade to be taken at 5348.

I was also looking at 123 pattern , and it did give a long signal at 5354 around 11:20 in the morning  , which was good too .
 
 
My eyes are seeing a -ve divergence developing in hour charts , One has to watch of any negation  ...
 
 
On Day charts we have a nice bullish candle today.so -ve divergence on hour charts may very well be nagated next trading session.
Slow macd on day charts has turned up just above zero , and has crossed the signal line , giving indications of more upside .
anything above 5402 is More Strength as 5402 is 80% of Last fall from 5448-5216
 
All in all Presently we are Trending up in all TFs we have closed above high emas in all TFs  .


BUT , a correction is on cards EW indicates so am keeping the fibb retracemnts of move 5216-5393 handy incase it comes.
Cheers !
 

Monday 10 September 2012

9/11/2012

Hour TA is OB ,
34 5 5 , has given a sell in hour TF .
Slow macd on day charts turned up just touching the zero line indicating bullish  , but has not triggered yet .
Day Rsi , has more room to OB .further up possible.
Hour TA and Day TA are not giving any clear signal to me presently .

on sidelines .
 

Sunday 9 September 2012

10th Sep 2012

  FIBO. RETRACEMENT TABLE              
From To Fall/ Rise 0.00236 0.38 0.5 0.00618 0.00736 0.008
5449 5216 233 5270.988 5304.54 5332.5 5360.041 5387.488 5402.4
 

Channel :

We have broken the downtrending channel cearly and have been now in upward channel ,
this is a very steep channel , will have to wait for some more time to draw it ,

Retracement s :

As we see , 5360 is 61.8 % of last fall from 5448 to 5216. we have done 5366 on sat.
and 5402 is 80% , So clearly anything above 5402 is clear strength.

And one trade that I can see presently is short close to 5387 with 5403 as SL .


Ew wise from 5216 we have done 5 waves ..as
Indicators :

Hour TA has reached OB region with last 2 days action .


50 and 20 MA are at the same value , they have been giving FF and FR .This time is it fast fall ? Only time will tell .


My inference is ,
We are close to completion of 5 waves , so a correction is on cards . Gap may act as support if there is any correction . Breaking 5309 would be the first sign . If not then 5402 must be broken for further upsides .

Day TF has one strong possibility as
 

Saturday 8 September 2012

Infosys

Last close 2487
 
TA which says Bullish ,
 
Week trend Up with momentum , with a close above WHema 2434.
Day High ema 2430 , Hour high ema 2484
Indicates trending Up .

 
EW counts
from 2101 Up  ,
 
a 2101-2483=382
b 2483-2332=151
possibility of c on in 5 waves Target can be ,

c 2332-** (  2714 if =A,) ( 2568 if = .618*A) Bullish
 
SS turning up from lvls close to 20  Bullish
 
Macd(  34 5 5) turned up near to 0 lvls Bullish with a + crossover . Macd Histogram also showing momentum .
 
Some charts to support my observations .....


Bearish Observations :

I see -ve divergence developing in hour TF
Hour TA is OB .
Gap ahead which may act as resistance .
If I join the top 3469 to recent low and Draw a || el line tangential to extreme move between the move , we are right at it presently , If we cross this and prices trade above this then this would act as good support . If not then down again .


Wednesday 5 September 2012

EOD 5th Sep 2012

Yesterday EOD the observations indicated towards a green day today and we open Gap down  and then after some consolidation , touch the day channel bottom .

I feel I missed looking at the week TF , which was down and did not take into consideration that it could assert itself .

So The Gap filled at 5216 . And we closed 5225.75
And touched the day channel bottom ,
Also on hour charts I saw a Hammer ( 1:00 O'clock candle) .
A Hammer at day channel bottom on hour charts  , good to take long calls with SL 5216 .
But Prices were trading below HLema DayLema and WLema . So resisted my self .

Presently the Hour channel resistance is at 5270 and
Day channel support at 5210


only on break of either of these two I will know where prices want to go for this month.
Divergence :

+ve Divergence still there in the hour charts .

Day TA is OS .

But Divergences fail when the higher TF does not align with the direction of divergence , Here Week TF is red and we have +ve  divergence in hour charts . So better to wait out for the Hour channel top to be taken out before any Longs .

34 hour- HI lo still says to be on the short side .


5 and 20 MA gave another fast fall today . This is the 4th time this combination has given FF since the top 5448.


EOD today , I feel bears have upper hand . Lets see how we open up tommorow.
 

Tuesday 4 September 2012

EOD 4th Sep2012

With today's close  at 5274

we closed above Hour high ema and  Day low ema  with  +ve divergence in hour charts still there  , and Macd ( 34 5 5) gives a buy in hour TF .

I do not have any positions presently will wait for tomorow , I did short in the first part of the day , covered it around noon with a small profit .

Day charts 9 Rsi in OS region with hour charts showing +ve divergence .

on hour TF 5-10ema  +ve crossover in place with the close ,


5 Day ema at 5283
Hour channel top also at 5282
DayHema at 5311

Fast MACD on hour TF , crosses over zero line .

Channel yet to be taken out ,


If we take out this channel top in tommorow's trading session , then it is a macd buy with +ve divergence .
All my obervations indicating towards a UP day tommorow . Lets see how we open .
Have a nice day !

Monday 3 September 2012

Eod 3rd Sep.2012

Things to watch ,
We ended with a insiders day with a close at 5253.75


Day 9Rsi is OS being below 20 , and there is a +ve divergence in hour charts .


With a close below Day low ema , we are trending down with momentum .
If this +ve divergence has to play then , without getting negated , we will get a close above Day low ema ( 5268) as first sign.
presently day channel bottom at 5205 lvls.


Did go long in the morning , thinking a bounce will come as last leg of wave B , but came out as the day low was broken .