This is my trading file to organise and jot down my take on the market .I do Technical Analysis. This blog is to keep track of my baby steps so that I can look back at my journey .Looking back tells me how far I have come from days when I knew nothing and can go further .It gives me motivation to keep going on even when I am tired. One has to back up trading with their own studies. The charts I post here are 99% inspired from Ilango sir.


Wednesday 28 March 2012

Personally this week is super busy , Posting here has become a routine life unless I am really occupied or I don't know what to write :) .
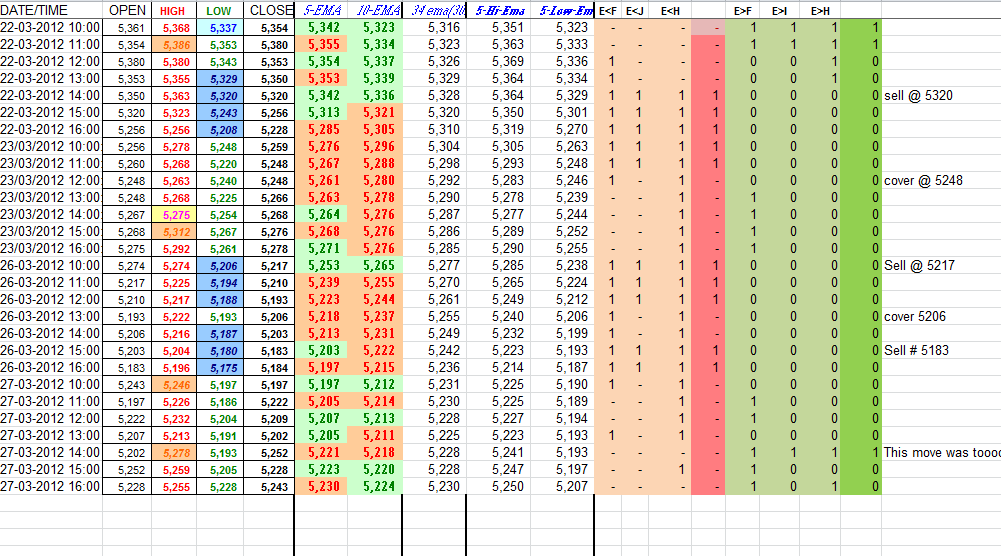
I will try my best to post the hour Hi lo ema with 34 ema trades sheet EOD, though I will not be taking any of the trades if genrated ., as I will be away from terminal for rest of this week . Moreover this is expiry week , expected to be volatile .

Tuesday 27 March 2012

EOD 27th March


We did close above the reqd conditions at 2:00 . But the move at 2:00 closing was toooo fast , If one would have known to take positions on break of 5230 ( upper trendine of falling wedge)then profitable/Otherwise avoid taking positions during such sharp and fast moves and wait for prices to settle down.

EOD close 5243.15
We did close above 34 ema on 30 min TF and above hour 5 ema  but we did not close above hour high ema ( 5250) . Which does not suggest to take long trade .
We have closed below 5 day ema (5257).
As per me bias is -ve.

Monday 26 March 2012

Hourly high Low combined with 34 ema on 30 min TF

Link to this excel file is Hi Lo Ema

P:S : I think the background color  in 5 ema 10 ema are not right . but the purpose of post is to combine hour Hi lo with 34 ema on 30 mins TF.


Thursday 22 March 2012

EW counts on 22nd march

22nd March 2012

some possibilities
Lets see the options we were following

Option 1 gets invalidated according to me at present .

Option 2
We are still in 4th wave and have done A as

W1-- 4531-4800 = 269
W2-- 4800-4588=212 ( .78% of 1)
W3-- 4588-5630= 1042
W4-- Going on
  • A--- 5630-5171= 459
  • B--- 5171 - 5499= 328
  • C going on should do 5 waves to down of which we are done with
C.1 5499-5233=266
C.2 5233-5386=153
C.3 in play will do 5 waves to down ..
i 5386 5329=57
ii 5329-5363=34
iii 5363-5206* 157 points is done already ..clearly it is an extended wave .
iv to up will unfold and as and when it retraces 61.8% it will be good place to go short .


OR Still doing B as a FLAT in 3 waves . In this

Option 3

A--- 5630-5171= 459
B Going on .in 3 waves as a flat...
a 5171-5499 = 328
b 5499 - 5206
Here 90% comes to 5202 ...we have almost done that ...now 'c' up in 5 waves ??

So option 1 suggests that we will soon reverse the direction ,
and Option 2 and 3 suggest more down side .

Lets see how prices unfold

time to sell !

Looking at weakness in prices I feel ,  its time to sell again at 5354
12:50 pm:

11:30 update 22nd march 2012


At 11:30 As we close below hour ema and hour high ema after resisting at cluster resistance zone of 5382-5392 ...This made me come out of longs taken at 5316 .
Now at 12:00 if we close below hour low ema as well ..then that will qualify to take shorts .

Wednesday 21 March 2012

EOD 21st march 2012


Close at 5365 .

The simplest of trading system says to be Long
Reason :we closed above 5Day ema .


Let me write down the important nos .
5Wema
5Dema
5Hema

Having closed above 5Hema and 5Dema and 5Wema ..The trend is UP in all three Time Frames .

Hour high ema is 5343 and momentum is clearly up in Hour TF.
As we closed above Dlema , " Buy on dips to high ema " has already played out , If prices close above day high ema now , Momentum will be up in Day TF as well and then one can safely hold the longs .

Bullish Zero line crossover :

Fast Rise ?

In day TF 5 ema has again taken a support of 34 ema . 13 and 21 ema almost at the same lvl . crossing these two lvls will be good for longs .
5ema at 5329 and 10 ema at 5337 .

Candle pattern :

i feel today was a  Marubujo  and its meaning A White Marubozu forms when the open equals the low and the close equals the high. This indicates that buyers controlled the price action from the first trade to the last trade.
Lets see what tomorrow brings !

Nifty Day chart.
.

Intraday 21st March

ORB 5267- 5288
It was broken down .
At 10:00 prices closed below day Lema .
and prices closed below the 5hour close ema at 5273 ...
Took a sell position at 5265 with target = 5240 and sl= day high 5287
-------------------------------------------------------------------

Update at 11:45
prices made a high of 5288 for the day then receeded . I took a sell position with reasons mentioned ORB was broken down and also prices closed below 5 hr ema , ( though they were above the hour low ema ) .

Was holding the position as prices were making lower high , so first my SL was 5288 , then moved it to 5284 ...then prices again dropped from this lvl , so then moved it to 5282 .
And then you can see , my SL was hit .
Though nifty spot travelled 20 points from my entry , But I had to give away close to 30 points inNF.

All those who visit me here and feel that I  overlooked "something" , that I should have taken into consideration  pls point it out ..so that our learning can grow.
-----------------------------------------------------------------------------


So High low system tells me to Go long at 1:00 close at 5316 I will keep a stop loss of 20 Points at 5296 . With every hour close we will  move this SL .
At 2:00 close lets move our stop loss to breakeven so that it covers brokerage so at 5321.

Now to 5330.


Tuesday 20 March 2012

Monday 19 March 2012

I had updated the nifty counts  on last friday  , you can find the link to page on the right side pannel .

Due to my other personal work , my writing here will be occasional , and not daily . More over summer vacations are here :-D ..what more can I say :))

Will continue after this gap .

Friday 16 March 2012

Budget day ends !

Today I witnessed what volatility is ...in matter of seconds the prices were jumping 50+ points during the day .
I came out today with a small portion market had to offer me , in the morning itself . Then looking at volatility I acted in "my best interest " by not entering again :)
Looks like the 3rd is going on  will try to enter again , as this 3rd settles and 4th starts to up .

Its amazing to watch the Index move up and down in wild swings !! How people make money in tons and loss in tons . I want to be a turtle ...as long as I do not stop!!

Camarilla Lvls for 16th March

---------------------------------------
Stock name Nifty 16th March 2012
Open     5,462.50
High     5,462.50
Low     5,362.00
Close     5,380.50
HL5  5481.347 Immediate upside target after Break Out
HL4 5435.608 Break Out on the Upper Side
HL3 5408.054 Go Long above these
LL5 5279.653 Immediate lower target after Break Out
LL4 5325.392 Break Out on the Lower Side
LL3
-------------------------
5352.946 Go Short Below These
-------------------------------------
Will Update these lvls as the day Opens

Thursday 15 March 2012

EOD 15th March

Candle Stick Pattern :


I feel Evening star Formed today. Bearish in nature .

------------------------------------------------------------------------------------------------------------------


I have been keeping track of Hour high and low Ema's Intraday and see that if followed with Discipline the it works most of the time  ..Especially during the trending moves .
here is a snap shot of excel file ....
 

Camarilla Lvls for 15th March

We opened at 5467 ...Which is between H3 and L3

-------------------------------------------------------------------------------
Stock nameNifty15th March 2012
Open 5,491.00
High 5,499.00
Low 5,438.00
Close 5,463.00
HL5 5524.28Immediate upside target after Break Out
HL45496.487Break Out on the Upper Side
HL35479.743Go Long above these
LL55401.72Immediate lower target after Break Out
LL45429.513Break Out on the Lower Side
LL35446.257Go Short Below These
----------------------------------------------------------------------------
Scenario 1: Open price is between H3 and L3
-
-
To enter long position (i.e. To Buy)o Wait for the price to go below L3 and then when it moves back above L3,
buy.
o Stoploss should be placed when price moves below (L3+L4)/2.
o Targets : Target1 = H1, Target2 = H2, Target3 = H3
To enter short position (i.e. To Sell)o Wait for the price to go above H3 and then when it moves back below H3,sell
or go short.
o Stoploss should be placed when price moves above (H4+H3)/2.
o Targets : Target1 = L1, Target2 = L2, Target3 = L3

-----------------------------------------------------------------------------
Now that we have gone below L3 which is at 5446 ...now we wait for the prices to move avove 5446  , if that happens we buy with SL= 5438 and T1=H1=5470 ;T2 =H2 5475 ; T3 = H3=5479.

Wednesday 14 March 2012

EOD 14th March

2nd Day Camarilla Update

We kept out stop loss at 5463 , but squared off at 5457 ..based on EW . We did go to 5438 for the day and completed 5 waves there as wave 1=68 points .
1  5499-5470
2 5470-5485
3 5485-5440
4 5440-5457
5 5457-5438

and  breaking 5457 to upside was confirming an abc retracement of fall from 5499 .
Continunning with EWcounts ...
this is one possibility

a  5438-5470 ( as zigzag)
b 5470- 5446 ( extended flat)
c to up going on can do =a = 32 which comes to 5478 lvls , which is also close to  61.8 %(5476) of fall from 5499 to 5438 ...If this count is valid then one can sell there .
Invalidation : If we go below 5438 now without touching this 5476 lvls then this above count is invalidated .
Now if we go below 5438 then we have done abc at 5470 and are in 5 waves down as Wave 3 of this move from 5499 .
-----------------------------------------------------------------------
Conclusion based on MA ,

5 Day ema is at 5389 and close above , will keep the trend up also to note is closing above day high ema at 5428 keep the momentum up as well .
 All in all Trend is UP hour wise , Day wise , Week wise and month wise .
no weakness in momentum .
The gap from 5430 to today opening at 5491 is also Not filled fully , we retraced to 5438 leaving 8 points .

Camarilla Update for 14th March

Stock name Nifty 13th March 2012
Open     5,391.05
High     5,438.65
Low     5,391.05
Close     5,430.00
HL5  5477.944 Immediate upside target after Break Out Immediate lower target after Break Out LL5 5,382
HL4 5456.199 Break Out on the Upper Side Break Out on the Lower Side LL4 5,404
HL3 5443.099 Go Long above these Go Short Below These LL3 5,417

We open at 5491 which is above H4 (  even H5)

Scenario 4: Open price is above H4
-
-
To enter long position (i.e. To Buy)
o NA. Buying is not suggested in such scenarios.
To enter short position (i.e. To Sell)
o Wait for the price to go below H3. As soon as the price moves below H3, sell
or go short.
o Stoploss should be placed when price moves above (H4+H3)/2.
o Targets : Target1 = L1, Target2 = L2, Target3 = L3.

--------------------------------------------------------------
So we wait for the prices to go below 5443 and then short there .That is good 30 points below the current level 5473.
----------------------------------------

Updated at 11:45
So prices break 5443 and our sell generates with a 20 points SL at 5463 .

Tuesday 13 March 2012

EOD 13th March

We had Golden cross today where on day charts 50 ma cross over 200 ma .
Also on day charts , 5 ema crossed over 10 ema . Both these cross overs indicating bullishness .


If in the below hour chart , 20 ma crosses over 200 ma then more upside ...If now 20 ma starts to fall then a fast fall , we have seen in recent past that this combination of 20 and 200 has worked very well for fast fall . Tomorows price action will confirm this .


On day charts Fast macd crosses the zero line today ...indicating bullishness .
Missed the opportunity to enter longs when nifty dipped to 5327 yesterday .


Camarilla update


 Thats it for the day !

Exploring Camarilla trading

13th March 2012

Intraday Trading Using Camarilla , so for next one month lets follow this method and see what are the gains . In my EOD updates I will also write the gains/Losses by this method .
-------------------------------------------------------------
Stock name Nifty
Open 5420.1
High 5420.1
Low 5327.4
Close 5360


HL5  5453  LL5 5,267
HL4 5411 Break Out on the Upper Side             Break Out on the Lower Side LL4 5,309
HL3 5385 Go Long above these                         Go Short Below These LL3 5,335
--------------------------------------------------

We opened at 5391  between H4 and H3 ...so we go long on breakout of H4 which is 5411 , and keep SL at H4+H3/2 = 5398  .

Update on Camarilla Trade ..


Monday 12 March 2012

EOD 12th march

5316 5 day ema ...Prices closed 5360 again above 5 day ema and thus day trend is up . 5 day high ema coincidently hour high ema as well at 5368 and close below this suggests weakness in prices to close ema and low ema .

Today we closed above 5 week ema at 5352 ...making the week trend up  for  now but again closed below the week high ema so its not confirmed that week trend is up.

5369 is pivot for tuesday.
Since markets are volatile , ORB along with Pivot lvls can be used to trade Intraday . For last 2 days ORB is guiding well about the direction of trade for the day.

Intraday 12th March 2012

Squared off the long positions .

                                         Open       High        Low         Close       5Ema       10Ema     HH          HL
03-12-2012 10:00          5,420          5,420          5,361          5,374      5,339      5,315      5,359      5,326
03-12-2012 11:00          5,373          5,377          5,352          5,364      5,347      5,324      5,365      5,335
03-12-2012 12:00          5,364          5,379          5,344          5,344      5,348      5,329      5,370      5,338
 ---------------------------------------------------------------------------------------------------------------
At 11:00 close 5364 we closed below the Hour high ema.
showing weakness .
5344 (Close at 11:30) at 12:00 is developing presently.

Sunday 11 March 2012

Momentum

If we can study Elliott wave along with Momentum , it will help us identify the begining and ending of waves .

How to Gauge momentum ?  .

A very simple way to gauge momentum is to watch the price action against moving average .

Short term   moving average of period 5 / 10 /  20 .
Medium term Moving average of period 25 / 50 / 100 .
Long term Moving average of period more than 100 / 200 .

If prices are trading above , then strength and if they are trading below then weakness for that respective timeframe.

One can chose hour , day , week or month TimeFrame.

When 5 period ma is above 10 , which is above  20 , then there is strength in the upward direction and vise versa .

In other words whenever short term moving averages are above the long term moving averages the momentum is UP and vise versa .


Presently Hour chart shows the various moving averages as


Prices have closed above 5 20 and 50 period moving average ...indicating ST strength UP . Also see ,  5 period and 50 period moving average are almost at the same level . Now a crossover will be bullish and if 5 period ma starts to fall , it will result in Fast fall .

Day TF moving averages are presently as


5 period ma touched the 34 period ma and moved up . If this continues then a fast rise in day TF .


Friday 9 March 2012

EOD 9th March 2012

We closed at 5334.

Lets look at some important lvls  ,

5323   5Hour ema
5329   Hour Hema
5258   Day Lema
5294   5 Dema
5342   DHema
5348   5Wema
5323   Monday Pivot.
5326  10 Dema
5329  21 Dema
5277  34 Ema

So we closed above most of these important lvls , except the DHema ( 5342) and 5Wema ( 5348) this is keeping the weekly trend still Down , But with todays close the Hour and Day trend are UP.

Moving Average:

If one takes position with hourly close then 10:00 close gave a buy signal today at 5313 in the morning with a close above hour high ema , but then it was a good Gap up as well ...so took support of  ORB as well. This also gave a buy signal as it broke it to upper range.

Divergence :

Take a look at the chart below ....


Starting 9th March

We are opening at 5294 gap up from 5220 .

The JNSAR is at 5344 .
We have opened above R2 for the day at 5282 ...Also opening is at 34 hr sma , if we trade above this lvl then bias for day is up .

I feel today ORB will be a good guide  .
 Aggresive Trade will be to go long now at 5303 ..with R2 as Stop loss.

Tuesday 6 March 2012

EOD 6th March

As I see the various indicators , the one that caught my eye was Hour slow macd with a positive divergence .

Moving Average:

Dema is at 5302 we clsoed well below that at 5222.
Day TF trend down
Hour TF trend down .
Pivot is at 5297 .

Channels :


As and when we break upper trend line of blue channel and close above it we can say we are in 5th wave up .

we have done the 38.2% of rise from 4588-5630 at 5231 ...now next is 50% at 5108.
Looking at the length of A from 5630 - 5268= 362
 If feel we have more room to go down as C . If one gets an opportunity , short with a close above hour high ema as SL.

Starting 6th March 2012


Keeping an eye on 50 and 200 sma for fast rise ...
If 50 now starts to rise ..then fast rise will materialize .

Update at 10:00
we closed at 5296 ..and Hour High ema at 5313 ..so did not take long position .One could have taken long at the break of pivot at 5297 though.
waiting and watching
***********************

We opened weak and touched and went beyond the 38.2% retaracement of the fall from 4588 - 5630 which is at 5231 ...we have done the requisite for the 4th wave ...we can be very well in the 5th wave to up

As wave 2 was deep , wave 4 has to be shallow .
34 D ema is at 5280 and now trading above 5300 ....If at 10 we close above this 5280 then upmove .

5302 is HHema , if we close above this as well then Buy on dips comes in picture .
5278 HLema

Monday 5 March 2012

EOD 5th March

5Dema 5341 ,
5Hema 5289 ,
5Lema 5278,
Day pivot 5297,
21 hr MA 5325,
34 Hr Ma 5348,
10 DEma TF 5373
DayLema 5309.

.


We closed above HLema but below HHema and 5HrEma.
Very Important that we close below day L ema at 5309 .
indicating downside .
34 Dema , very important moving average , is at 5280 , Opening itself  will tell if weakness or strength ?


Looking at the day chart , It looks to me like 4th wave on in a ZZ (A B C ) . A and B done and now C going on in 5 waves down .


Moving Average:

For any upmove we have to close above 5341 the 5 DayEma .

Channels :

Upper green channel still intact , break of the channel upside will indicate that we are done with wave 4 and are in wave 5 which will go min = wave 1

Fibonacci Retracements:

5231 38.2% of 4588-5630
5108  50% of 4588- 5630

Look at this 9 Hr rsi chart ...RSI has made a triangle . I also see small +ve divergence .Is 4th wave coming to an end ? and 5th to start

Conclusion :
todays close is 5280. Break out of Range from 5275-5300 ,will give direction for trade tomorow .

Plan for 5th March

Did go short as per the plan with one lot of mini nifty(20) ...watched plus and minus in the account ..and at a point had strong urge to square off with having 20 points profit ...but then held and then watched the pointer go up again .  In 2 min TF prices broke the 34 period MA and closed above it  , was watching 5 min TF carefully and prices started to touch 34 period ma there also ..so came off  at the price entered bearing loss of  brokerage cost .

Leasons learnt today ....
  • I should have waited for the prices to close above the 34 period ma , before squaring off   .
  • I should have taken 2 lots so that , could have booked 20 points on 1 lot which could have fetched me brokerage + , keeping my capital preserved , while holding on to the 2nd lot .
  • Preserving capital is the main goal  , so that i can play for Long .
  • Intraday 20-30 points is good for me .

+++++++++++++++++++++++++++++++++++++

ORB for today is 5303-5345

breaking 5297 as per last post will suggest that we are in 3rd wave down of C .
Prices are trading below Hour 5 ema and HLema ( 5339) .
10:00 close will also give a clue and also if
If ORB is broken down before 10:00 , I will go short for the day , with a small sl and a small target.

Friday 2 March 2012

EOD 2nd March 2012


I have drawn 2 yellow lines to denote the range of Big bar that covers next four days candle ...so  any move past these two lvls will suggest the course prices may take .


Today prices resisted at the upper Blue trendline ...


A triangle under formation ?
 
or Are we in C ? with B over at 5459 off which 1 and 2 done 3 will unfold ..if that happens we will break 5324 first then 5310 then finally 5297 ...break of 5297 will suggest that sub 5200 lvls will be touched .

Day trend still DOWN with a close below 5 day ema .

moving averages alinged , giving no clear signal ...If prices from here move up and 20  starts to rise it will be fast rise and if cross over takes place then we go DOWN.

Also short term moving averages are converging on hour chart ...break of  either 5459 or 5298 will give good gains on that side .


Nifty Counts

Bullish Counts

A  5630-5268
B Going on
    a   5268-5459
    b   5459-5297
    c Going on
        i   5297-5392
       ii   4392-5324
       iii  Going on
( Invalidation prices Going below 5324 and further confirm it by going below 5297)


Bearish Counts

A 5630-5268
B  5268-5459
C Going on in 5 waves down
   i    5459-5297
   ii   5297-5392
  iii Going on down in 5 wave s...

Confirmation if prices go below 5297. Invalidation ===> if go above 5459.

Trade plan for 02 March

Looking at EW probablities ...
we see that move down from 5630 is a 5 wave , so we are in a ZZ
now we did ist set of 5 waves at 5268 making
A   5630 - 5268 = 362
From here two possibilities arise ...
  1. either we finished B at 5459 in 3 waves and have started the C to down in 5 waves off which 1 and 2 are done and now in 3rd to down will confirm if we break 5298 . 
  • so B  5268-5459 = 191 ( 53% of A)
             C Going on in 5 waves
            C.1  5459-5298 = 161
            C.2  5298-5369 = 71 **** Going on  unless 5298 is broken to down
         
  1. Or we have a B which is Flat / can be irregular flat for this nifty has to break 5459 and move past it  . We did open at 5369 but then are falling from there
  • so B.a 5258-5459 = 191
               B.b 5459-5298= 161( 84% of B.a)
               B.c ** going on has to go close to lvls 5459 or Above it .
Then C will start to DOWN in 5 wave s...


todays ORB range is 5,315.05 - 5,369.45
break of 5315 we can be cautious and break of 5298 , we can go short .

Break of 5369 to up , may go long not too sure about it .