This is my trading file to organise and jot down my take on the market .I do Technical Analysis. This blog is to keep track of my baby steps so that I can look back at my journey .Looking back tells me how far I have come from days when I knew nothing and can go further .It gives me motivation to keep going on even when I am tired. One has to back up trading with their own studies. The charts I post here are 99% inspired from Ilango sir.


Wednesday 5 December 2012

EOD 5th Dec 2012


Back after a long vacation .


EW wise
Wave C from 4770 In 5 waves ..
 
 
And now the last wave 5 from 5548 in 5 waves ...

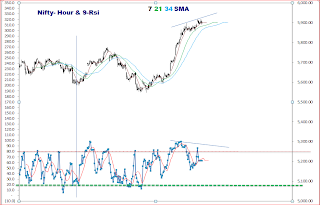
As I see the hour charts -ve divergence is quite prominently seen between the points 5899 (iii) and top made today at 5918 (v)indicating the 4th wave is on after which final 5th might unfold.

Also to keep in mind is this -ve divergence is seen in hour charts  when indicators are OB in day charts..
 

If we see -ve divergence is developing in day chart as well .It holds or negates , only time will tell giving us clues on its way.


I could only do this much HW .