Prices :
I see that All the high ema s are lined up in decending order . Low ema are all shuffled up .
As Hour Low ema has moved above the Day low ema I see that Hour trend is UP and its very close to being more that Week low ema . As that happens weekly the trend will be UP . The direction is UP.
Monthly and weekly low emas are lined up alright .
For now I can say if the Green box continues to go above purple and blue the trend will be UP.
I will follow this everyday to see if I can derive something out of it .
Moving average Band

Trendline / Channels
 The Slow macd has crossed the 0 line and moved up , indicating prices to go up .
Prices have broken the channel as well and now trading outside it.
There is +ve Divergence as well present in the chart .
| MHema | 5321 | |||
| WHema | 4941 | |||
| DHema | 4726 | |||
| HHema | 4712 | |||
| HLema | 4675 | |||
| DLema | 4619 | |||
| WLema | 4689 | |||
| MLema | 4732 |
I see that All the high ema s are lined up in decending order . Low ema are all shuffled up .
As Hour Low ema has moved above the Day low ema I see that Hour trend is UP and its very close to being more that Week low ema . As that happens weekly the trend will be UP . The direction is UP.
Monthly and weekly low emas are lined up alright .
For now I can say if the Green box continues to go above purple and blue the trend will be UP.
I will follow this everyday to see if I can derive something out of it .
Moving average Band
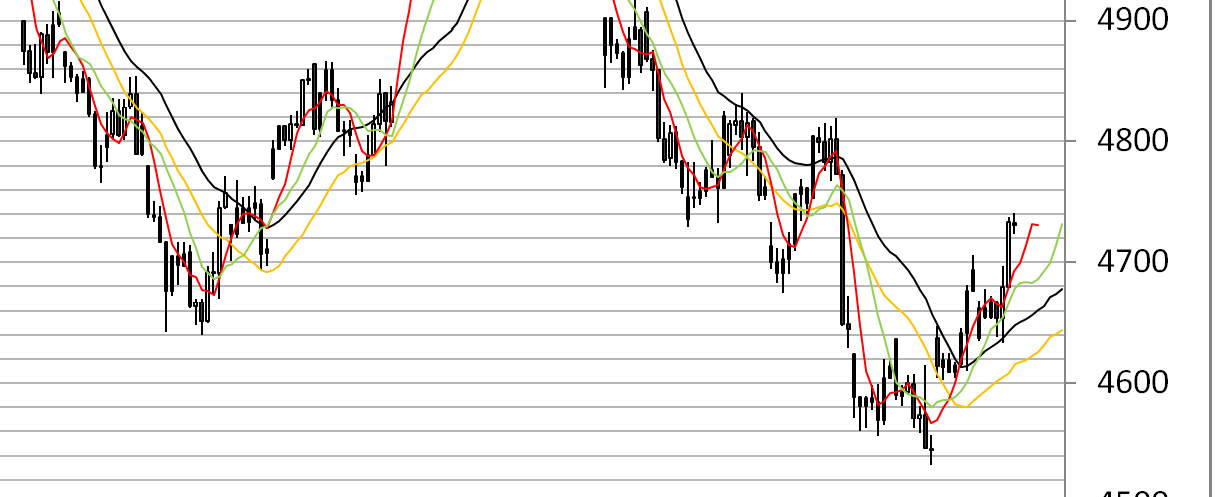
Above chart is 20 hour high and low band plotted n hourly chart with 5 and 10 MAs .
A buy signal is generated, As we can see here the signal line ( Red ) crossed the lower band(yellow) at about 4590 lvl and also at the same lvl 5 ma crossed 10 ma (Green) .
At present is confortably placed well above 10 ma as a trailing stop loss we can keep a watch when 5 ma again crosses the 10 ma.Nifty has already travelled ~130 points after the signal was generated . Trendline / Channels

Prices have broken the channel as well and now trading outside it.
There is +ve Divergence as well present in the chart .