This is my trading file to organise and jot down my take on the market .I do Technical Analysis. This blog is to keep track of my baby steps so that I can look back at my journey .Looking back tells me how far I have come from days when I knew nothing and can go further .It gives me motivation to keep going on even when I am tired. One has to back up trading with their own studies. The charts I post here are 99% inspired from Ilango sir.


Monday 17 December 2012

EOD 17/12/12

 
Do we have a Rounding top formation with TL at 5839 break of which might target 5700 lvls?
 

Fast Rise or Fast fall is coming ...as averages will give the direction

5 sma 5860
20 @ 5866
100 @ 5862


Thursday 13 December 2012

EOD 13th Dec 2012

Trend is down with momentum with a close below DLema ( 5858)
 
 
Hour Chart
 
 
 100 SMA @ 5828

Wednesday 12 December 2012

EOD 12.12.2012

 
We closed < 5 Dema , making the day trend down , Sell signal on hour charts as well .
DLema at 5867 with a break of this and close below, sell gets confirmed. 


 Sell signal on day charts issued with the divergence  .


EW wise I feel we are still in corrective to fall (5965-5865) , IF 5865 breaks that wud be another confirmation of "sell" generated today.

Tuesday 11 December 2012

EOD 11th Dec 2012


My HW for the day , read once more about characteristics of impluse waves with guidelines make notes .

Day trend intact with a close > 5DEma .

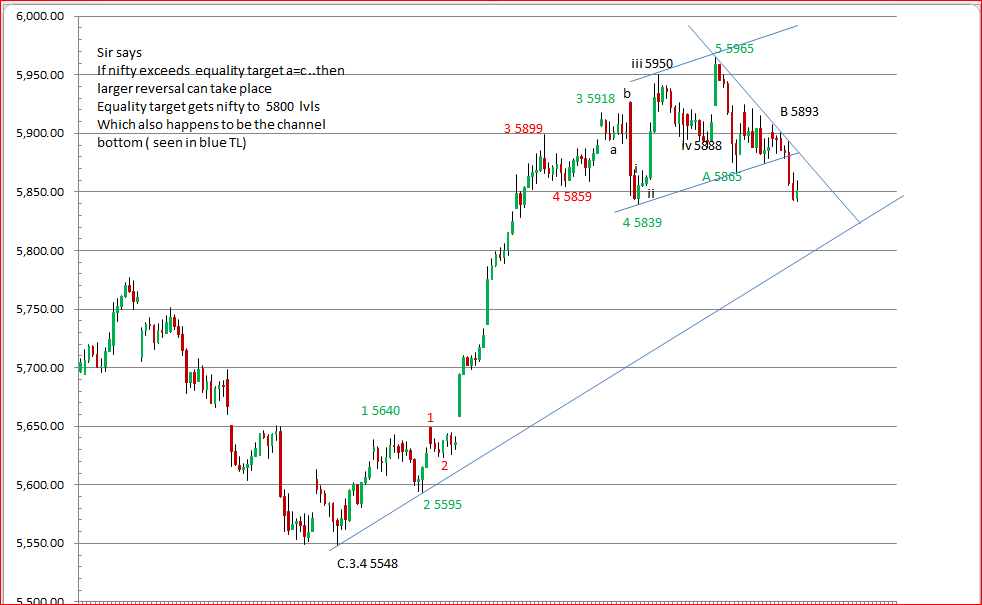
Clear 5 waves from the top today at 5965 to 5865 , so for tomorow I am keeping the retracements of this down move handy .


 From   To   Fall/ Rise  0.236%        0.38                 0.50 0.618% 0.736% 0.80%
5965 5865       100    5,889    5,903             5,915    5,927      5,939      5,945


Price > 5945 would mean we are in 5th wave
If we start to retrace from the zone 5927-5945 then might be in C.4 ,
and we will not go below 5348 which is top of C.1

-ve divergence played out well today , a 100 point move.

Monday 10 December 2012

EOD 10.12.2012

 
On hour TF 5 and 20 mas are at the same point ,fast rise or Fast fall ?

Hour Divergence
 Day Divergence


Friday 7 December 2012

Wednesday 5 December 2012

EOD 5th Dec 2012


Back after a long vacation .


EW wise
Wave C from 4770 In 5 waves ..
 
 
And now the last wave 5 from 5548 in 5 waves ...

As I see the hour charts -ve divergence is quite prominently seen between the points 5899 (iii) and top made today at 5918 (v)indicating the 4th wave is on after which final 5th might unfold.

Also to keep in mind is this -ve divergence is seen in hour charts  when indicators are OB in day charts..
 

If we see -ve divergence is developing in day chart as well .It holds or negates , only time will tell giving us clues on its way.


I could only do this much HW .