We closed at 5350.25
Moving Average:
Hour trend was down , already and though we were closing above HLema for almost all day , around the last hours not only closed below the hour low ema , but DLema as well making the Day trend down with momentum .
Day low ema 5363 .

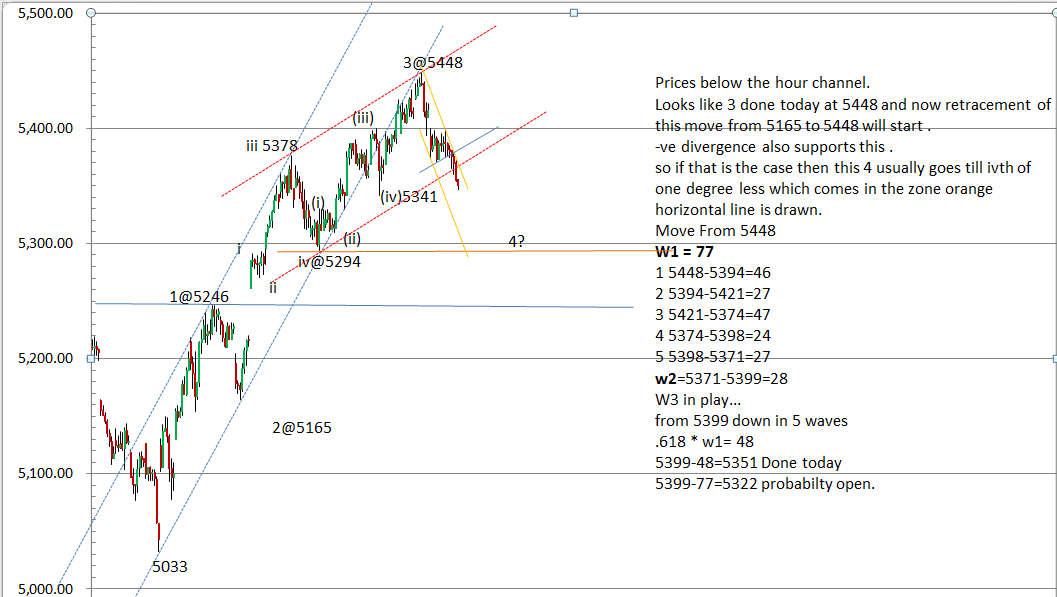
EW lables can be seen as in the following chart.


Moving Average:
Hour trend was down , already and though we were closing above HLema for almost all day , around the last hours not only closed below the hour low ema , but DLema as well making the Day trend down with momentum .
Day low ema 5363 .
Keeping a watch on yellow UTL will be my guide .
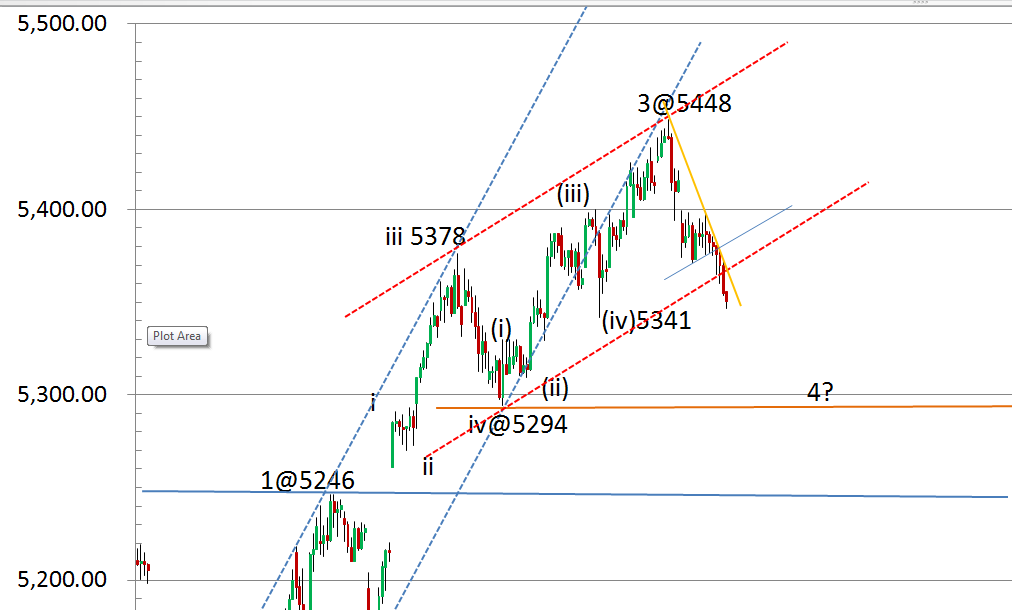
EW lables can be seen as in the following chart.
Keeping a watch on 20 / 50 ema as well , they are at the same value resently , change in value with respect to each other may guide further .

| FIBO. RETRACEMENT TABLE | ||||||||
| From | To | Fall/ Rise | 0.00236 | 0.38 | 0.5 | 0.00618 | 0.00736 | 0.008 |
| 5033 | 5448 | -415 | 5350.06 | 5290.3 | 5240.5 | 5191.447 | 5142.56 | 5116 |
| 5399 | 5347 | 52 | 5359.272 | 5366.76 | 5373 | 5379.146 | 5385.272 | 5388.6 |