This is my trading file to organise and jot down my take on the market .I do Technical Analysis. This blog is to keep track of my baby steps so that I can look back at my journey .Looking back tells me how far I have come from days when I knew nothing and can go further .It gives me motivation to keep going on even when I am tired. One has to back up trading with their own studies. The charts I post here are 99% inspired from Ilango sir.


Wednesday 27 June 2012

Today whole day , we traded in a very narrow range .
Moving averages were telling one story and EW was telling another .
different methods were not complimenting but contradicting each other so stayed away and was just watching the screen and where prices are going ..

There was this point for short trade when nifty touched day high was not able to sustain , unfortunately it came during my break from terminal between 12:45 to 1:15 .
Did take a short trade and made some tiny points , which did not stay with me for long as I shorted again when it broke the low and came out with a min loss as it broke the channel I drew touching the highs today.

Tomorow is a holiday for me , see you all on Friday.
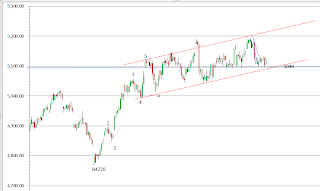
Trading 27th June 2012

I updated the EW counts page yesterday ...Kindly check that for todays trading lvls .

http://mytradingfile.blogspot.in/p/ew-20th-june-2012.html

Tuesday 26 June 2012

EOD 26th June 2012


Still in range . 5090-5100 is very strong support. We may go up from here to the channel top as long as 5090-5100 is not broken.

Monday 25 June 2012

EOD 25th June

Day close 5115

How does one decide the trend is going on up or down ?
Momentum Indicators tell us that by closing above or below the 5 ema of that TimeFrame.

So looking at the ema s to gauge the momentum we find the

Day Trend turns down yet again , by closing below 5 day ema ( 5125) .
with Hour trend turning down with 3:00 close and by EOD we also have 5 ema crossing below 10 ema.

hour low ema at 5132 we have closed well below that now next thing to look for is day low ema poised at 5089 , we may see again a range bound day if we take support at this low ema Or see trending move down if we break this lvl.

This zone 5085-5100 acted as a strong support in recent times and is to be watched anything below 5085 would be favoring shorts .

Divergence :

Day chart indicators are showing -ve divergence with 9 rsi and fast macd .


Indicators :
HOur chart SS turns down from OB and breaks the LTL.

All the above says more down move , this downmove can take support at previous support 5085-5105 .
If we break this support then more downside  .


Intraday 25th June

Opening at 5159.

which is more than Previous day high and also more than Previous day close .
We also opened above HHema ...Clearly bias for the day +ve .

At 10:00 we maintained Day open as Day low  ...so break of ORB (  5159-5185) to  upside , should be indication of Long and less risky trade with day Low as SL.
Contradiction to this is to keep in mind the BIg picture , where in day charts 5190 is important number being recent swing High and channel top on hour charts .

that has been acting as stiff resistance till  now .
Along with this I see -ve  divergence in intraday charts ..which is holding me back to take long calls.

 1;30
Prices taking support at yesterday's high ...I feel its a good place to go long . There my SL pops below day low 5159.

Sunday 24 June 2012

Keeping it simple.

Last close 5146 .

clearly month , week , day , hour trend is up.

Day TF says
5152 is Day high ema , which may act as resistance and if price s cross this and trade above it , then will act as support and will be a good zone to go long as Day trend is up as we are closing above 5 Day ema .


Hour TF says ,

Also we closed  just below the hour high ema , and if Prices resist here at 5148 lvls then we may again see a range bound day . Between high and low ema of this HOur TF


So depending upon where the prices are opening , one can gauge , if it will be a trending day ( we open above hour high , and day high bias of day will be positive and if we maintain that as the low of the day or take support in the zone 5140-5160) .
Or we are for a range bound day if we open below the zone and maintain that as high of day .

anyhow 5140-5160 is the zone , and prices opening above or below it will give further cues.

------------------------------------------------------------------------

Over the weekend , I was looking at day charts , and observed that days when Day open is either the high of day or low of day ...those days chances of successful trade is high on  orb break .
Like if Day open = Day high ( ORB high), and ORb breaks the low then " shorts" are more likely to survive and vice versa.
I don't know if this really works , I would like to watch this over next weeks to come to see if this works .

I truly feel that looking at old charts and then thinking I can figure out where to go long and short and all this is easy , but when  Live market is unfolding it is altogether a different story .

All the best to all of you out there , who want to make it "Small" here :) like me.


Friday 22 June 2012

22nd June 2012

With yesterdays close

Month trend turned up , Week is up , day is up  , now when we had weakness in hour TF in the morning , and when after 2:00 close when hour trend turned up then that could have taken as a valid signal to go long .

Now trading at channel toop  tells me correction can be there today and if we break this channel then up we go .

it is very true that all this analysis is Ok , but It really is worth , when I  put it in practical and get results  . Thats when I will be satisfied with what I am doing .

Right now on sidelines .

Thursday 21 June 2012

Trading 21st June 2012

Update at 1:30
Now I did take a short today , as we completed 5 waves from 5142-5095 and started retracing the move

Fib retracements were ...
 From   To   Fall/ Rise  0.236%        0.38        0.50 0.618% 0.736% 0.80%
5142 5095         47    5,106    5,113    5,119    5,124      5,130      5,133

Prices bounced to 5122 ( almost golden ratio ) and started to decline...Wanted to short right at 5120 , but kept thinking and gathered the courage to short at 5110 keeping the SL= 5134 reason being ,  As we can see the 80% is 5133 so above that means the ew count was wrong .

Kept holding on to the position till 1;30 was in a way happy to see that it had broken the day low ..
Did not want to  loss a single penny so moved my SL to 5105 NF . Idealy as it made another low of day SL should have been 5112 marked in red line ,

Also prices closed below hour low ema at 1:30 closing .
But then NF started trading at premium , and my 5105 NF hit ...so am out of position without any loss .

----------------------------------------------------------------------------------------------
If Prices move again in the same range as yesterdays , it will be no trade zone for me .

We closed below hour high ema , for down momentum we need to close below hour low ema (5113)
then and then  only it will gain strength to go down in hour TF

Day TF we have DLema at 5063 which is way below the prices at present , so lets look at 5 ema (5100)...so prices need to close below this for any downward direction .

For me Short If prices close below hour low ema accompained by close below 5 ema . And to be on safer side break below 5096 ( ORB Low) and if they break 5087 then a sure shot sell .

For me Long if and only if prices trade above 5144 a strong resistance as seen in last couple of days ..

Tuesday 19 June 2012

important #s for 20th June

5090 is Dema , Hour ema and also the pivot for 20th june Trading above or below it , can be strength or weakness.If we close above 5134 tomorow then week and day trend will become in uptrending mode.

Following can further gauge the momemtum ...

EOD 19th June 2012

Today was the day , I was determined to earn something out of the market .
And market on other hand was determined not to let me win , I did catch the bottom and top today but unfortunately in the opposite direction of market and my trades resulted in loss today .
Presently reading Frost and pretcher again ...to understand EW more and more .

They say trade a small qty , so that you can be in the race for long time ....me doing this correctly ..trading only mininifty.

Monday 18 June 2012

EOD 18th June

Candle stick pattern

Bearish Engulfing is what we have today ..which not only engulfs yesterday's candle but  engulfs last 3 days candle .
 Also we call today as an Outside day .

channel
Today we broke the hour channel at 5069 , and touching low at 5041.

Momentum
Momentum is clearly down as we close below hour low ema ,
with todays close we have
Hour trend down ( 5 -10 bearish crossover happened )
Day trend down ( 5-10 crossover not yet taken place . )

Divergence

-ve Divergence played out well today .

Candle stick , channel , momentum all indicate a lot of weakness in prices .

Hi - Lo 34 hour ema says one should have shorted at 5080 with 5100 SL at 12:00 today .


I still have to work on EW labels ...which help a lot , and once a wise soul told me , is the only thing which never fails .

Intraday 18th June

breaking 5069 todays low would be first indication of further downside .

Looking at the chart below we find that


Friday 15 June 2012

Observations for 18th June

Candle pattern :

We have a white Marubojo , indicating bullishness .
And EW wise accompnained by 3rd wave . more upsides.

Trend in different TFs saying
Hour trend up
Day trend Up
Week is up
Today's closing makes the month trend up as well .

Closed above mondays pivot 5118

Prices indicating only upsides from here ...

Indicators
Indicators on hour chart are showing -ve divergence .

Price clusters ( support / resistance)

It becomes very important to cross this5140-5150 zone for now and then  5170-5190 zone for further upsides .

Fib retracements .

 From   To   Fall/ Rise  0.236%        0.38        0.50 0.618% 0.736% 0.80%
5630 4770       860    4,973
Done
   5,097
Done
   5,200    5,302      5,403      5,458

15th June Intraday

9:45 AM

I see Open and Low same so far in a 30 min candle .
ORB 5069-5096
watching for ORB break with Macd crossover , Ss Divergence .
My trade Plan for the day .

If 5096 breaks with +ve divergence in ss and macd crossover , then BUy with 20 ots SL . Also 5084-5095 is the resistance zone above which prices may further go up .
also 123 strategy calls for a buy on break of 5096 to up.

IF 5069 breaks with -ve divergence in ss and macd crossover then sell with 20 pts sl.

Thursday 14 June 2012

obervations for 15th june

Hour TA remained down for the whole day and spread accross on Day TA , as prices closed below 5 Dema making the hour and day trend down now .

we have closed below pivot (5077) as well.

On hour chart we are at channel bottom , breaking this bottom trendline leads to more downside and a bounce is also possible ( for that price will start to close above hour low ema ) For now  prices closing below hour low ema and also below 5 day ema / and 5DHema shows weakness.
On day chart , its evening star pattern indicating bearishness.
Technicals show weakness all over .

retracement of 4770-5144 are


 From   To   Fall/ Rise  0.236%        0.38        0.50 0.618% 0.736% 0.80%
4770 5144      (374)    5,056
Done 
   5,002    4,957    4,913      4,869      4,845
                                               

14th June 10:00 close

1st hour candle Open and low the same at 5105

We close above hourLema (5108) at 10.00 Inference , nifty may move to close ema and then hema as well .
Also closed above Dhema (5109)
Orb was 5127-5105  : which is not broken yet .

Inference : Can not short at present

Wednesday 13 June 2012

Obervations for 14 june

All low emas in TT are alinged in increasing order .
Also the 5 emas are in increasing order ...
Now we have to wait for high emas to be also in increasing order , so that we can say a top is formed .
all of them infact are in increasing order expect for the last hour hour high ema which is less than the previous value . Day Pivot being at 5120.hour high ema at 5134
5121 is 5 ema , and we have closed right at 5121 .5109 is Hour low ema now a close below this can be used as shorting opportunity .
and a close above 5134 , a buy .
presently SS in OB region
I see -ve divergence in hour charts with 14 RSI  , Fmacd and SS indicators .

we have a spinning top formation today eod , which is indecisive , after a bullish engulfing day before .

Contradicting observations

  • We have a Bullish Engulfing yesterday eod . Expecting more upsides .
  • Prices closing above High emas showing upward momentum .
  • EW labeling tells me to expect a down wave now .
As I write this 123 strategy generated a BUY at 5123 .

11:20

Out of the position Sl hit at 5113

Friday 8 June 2012

EOD 8th June 12

Trendline :

Today's high falls exactly at the trendline making it now 4 points touching the trendline seen , making it a strong one .
This trendline can act as strong resistance on monday .
On monday if we see prices breaking this trendline and trading above it then , this line will act as strong support . And if we open below this and stay below , then chances of price going down .


Moving Average:

We have just closed below WHema ( 5072) .
In Day/Hour TF it is trending phase as we have  closed above High ema s


Looking at EW will help . I will work on it .

Trade on 8th June '12

12:30  pm

First trade today morning .
My Mindset was If prices open above Pivot then I will sell on break of 5039 (p) . It broke the Pivot and After  waiting for first few minutes I saw weakness in prices so ..

Sold NF @ 4995 in the morning as
Reason 1 : prices broke first Reaction low of the day ( 5017).
Reason 2: developing Hour Low ema was at 5024 ( 9:45 AM) and price closed below that .
Showing weakness as such Hour TA was OB.


Closed the position ( 10:50 AM) with 15 points loss looking at the pattern developing which was making higher  high and higher low .
Also prices started closing above (developing 11:00 AM ) hour low ema .

unfortunately I closed my position and next second , prices start to drop.

EOD :

As I think what wrong move I made ...I think I closed my position right at Pivot point which was 5039 . I should have waited for prices to break Pivot and then close the position . Pivot acted as resistance and prices retraced from there .
Trailing the SL is very important as the market is unfolding , we saw what happened in the last hour today ..

Thursday 7 June 2012

1-2-3 Strategy / EOD 7th June '12


Let me start again after a long gap updating this blog with this 123 strategy I came
 across today . After reading it looked quite simple to follow so followed it in live market .

One can read about it at http://www.tradeprofitably.com/The_1-2-3_Breakout_Trading_System.html

this gave me clear 20 points today in a long position taken around 12:46 time and trailing the SL.

The black line after 2 shows the entry point at 5028 .
and then subsequent TSL.

EOD 7th June
Important Lvls for the Day 7th June EOD
Day TF Values Hour TF Values
5Dema        4,964.3 5Hema 5038
5Hema           4,983 5HHema 5047
5Lema           4,910 5HLema 5028
Day Pivot 5039    
21 hr MA 4960.7    
34 Hr MA 5005.9    
10Dema        4,942.3    
Last Close 5050

 
Day and hour trend up  and we have closed above DHema as well HHema indicating upside momentum gaining strength .
5 Dema has crossed over 10 Dema indicating bullishness.
Also to watch is that 20 MA is approching 200 MA . It will result in Fast fall if 20 turns down soon ( chart below )
and  If 20 crosses over 200 then more upside.