We closed at 5669.6
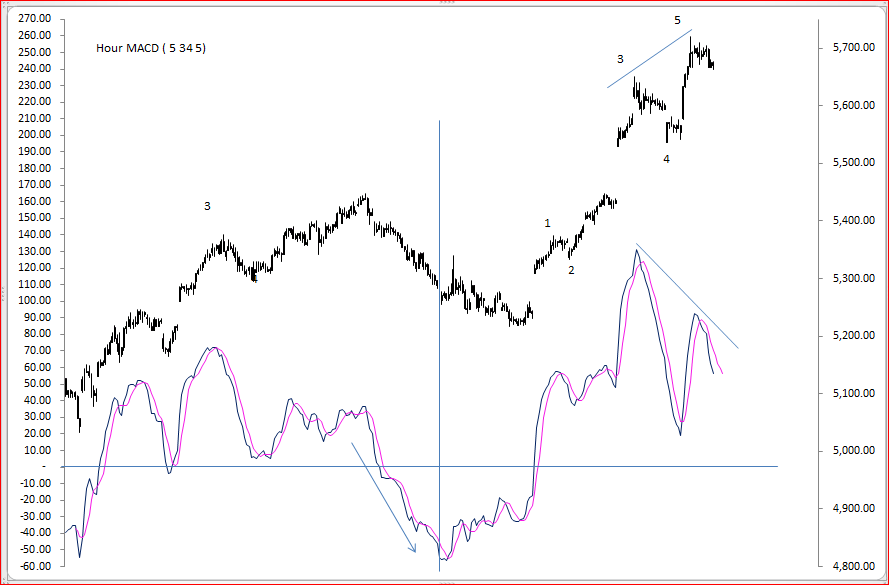
Hour trend down with a close below hour 5 ema ( 5677) , hour low ema at 5669 , a close below this would bring down momentum in hour TF .
Day high ema at 5648 5 day ema far below at 5618
-ve divergence prominent on hour charts ...with a sell triggered today with a cross over of macd ( 34 5 5). But again , Day high ema is at 5648 unless we close atleast below that ,this is just a correction IMHO.

Still vth of 5th pending . lets see if that comes next trading session , or more weakness
Hour trend down with a close below hour 5 ema ( 5677) , hour low ema at 5669 , a close below this would bring down momentum in hour TF .
Day high ema at 5648 5 day ema far below at 5618
-ve divergence prominent on hour charts ...with a sell triggered today with a cross over of macd ( 34 5 5). But again , Day high ema is at 5648 unless we close atleast below that ,this is just a correction IMHO.
Still vth of 5th pending . lets see if that comes next trading session , or more weakness