This is my trading file to organise and jot down my take on the market .I do Technical Analysis. This blog is to keep track of my baby steps so that I can look back at my journey .Looking back tells me how far I have come from days when I knew nothing and can go further .It gives me motivation to keep going on even when I am tired. One has to back up trading with their own studies. The charts I post here are 99% inspired from Ilango sir.


Friday 2 March 2012

EOD 2nd March 2012


I have drawn 2 yellow lines to denote the range of Big bar that covers next four days candle ...so  any move past these two lvls will suggest the course prices may take .


Today prices resisted at the upper Blue trendline ...


A triangle under formation ?
 
or Are we in C ? with B over at 5459 off which 1 and 2 done 3 will unfold ..if that happens we will break 5324 first then 5310 then finally 5297 ...break of 5297 will suggest that sub 5200 lvls will be touched .

Day trend still DOWN with a close below 5 day ema .

moving averages alinged , giving no clear signal ...If prices from here move up and 20  starts to rise it will be fast rise and if cross over takes place then we go DOWN.

Also short term moving averages are converging on hour chart ...break of  either 5459 or 5298 will give good gains on that side .
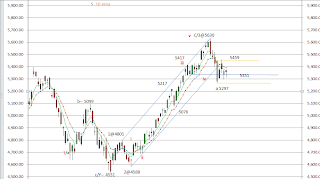

Nifty Counts

Bullish Counts

A  5630-5268
B Going on
    a   5268-5459
    b   5459-5297
    c Going on
        i   5297-5392
       ii   4392-5324
       iii  Going on
( Invalidation prices Going below 5324 and further confirm it by going below 5297)


Bearish Counts

A 5630-5268
B  5268-5459
C Going on in 5 waves down
   i    5459-5297
   ii   5297-5392
  iii Going on down in 5 wave s...

Confirmation if prices go below 5297. Invalidation ===> if go above 5459.

Trade plan for 02 March

Looking at EW probablities ...
we see that move down from 5630 is a 5 wave , so we are in a ZZ
now we did ist set of 5 waves at 5268 making
A   5630 - 5268 = 362
From here two possibilities arise ...
  1. either we finished B at 5459 in 3 waves and have started the C to down in 5 waves off which 1 and 2 are done and now in 3rd to down will confirm if we break 5298 . 
  • so B  5268-5459 = 191 ( 53% of A)
             C Going on in 5 waves
            C.1  5459-5298 = 161
            C.2  5298-5369 = 71 **** Going on  unless 5298 is broken to down
         
  1. Or we have a B which is Flat / can be irregular flat for this nifty has to break 5459 and move past it  . We did open at 5369 but then are falling from there
  • so B.a 5258-5459 = 191
               B.b 5459-5298= 161( 84% of B.a)
               B.c ** going on has to go close to lvls 5459 or Above it .
Then C will start to DOWN in 5 wave s...


todays ORB range is 5,315.05 - 5,369.45
break of 5315 we can be cautious and break of 5298 , we can go short .

Break of 5369 to up , may go long not too sure about it .