
I have drawn 2 yellow lines to denote the range of Big bar that covers next four days candle ...so any move past these two lvls will suggest the course prices may take .
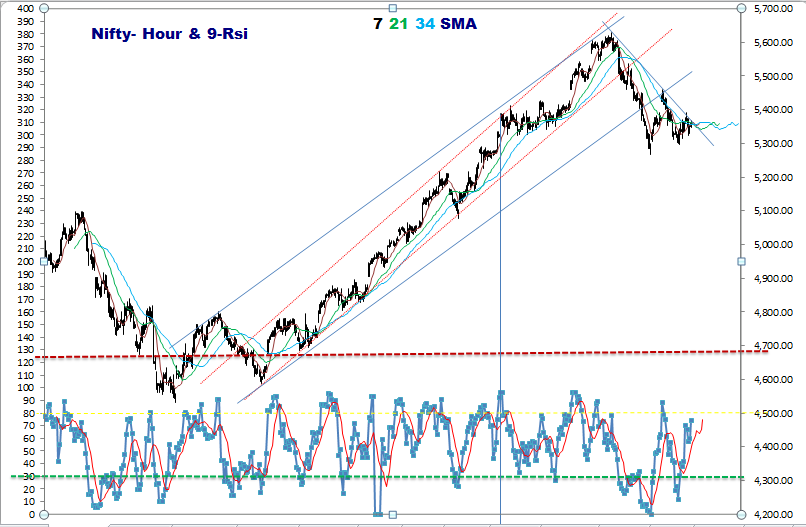
Today prices resisted at the upper Blue trendline ...
A triangle under formation ?
or Are we in C ? with B over at 5459 off which 1 and 2 done 3 will unfold ..if that happens we will break 5324 first then 5310 then finally 5297 ...break of 5297 will suggest that sub 5200 lvls will be touched .
Day trend still DOWN with a close below 5 day ema .

moving averages alinged , giving no clear signal ...If prices from here move up and 20 starts to rise it will be fast rise and if cross over takes place then we go DOWN.
Also short term moving averages are converging on hour chart ...break of either 5459 or 5298 will give good gains on that side .
No comments:
Post a Comment