Closed at 5708
Clearly hour trend turns up with momentum and it issued a buy at 5696 at 2:00 , and at 3 close 5-10 +ve crossover also seen .
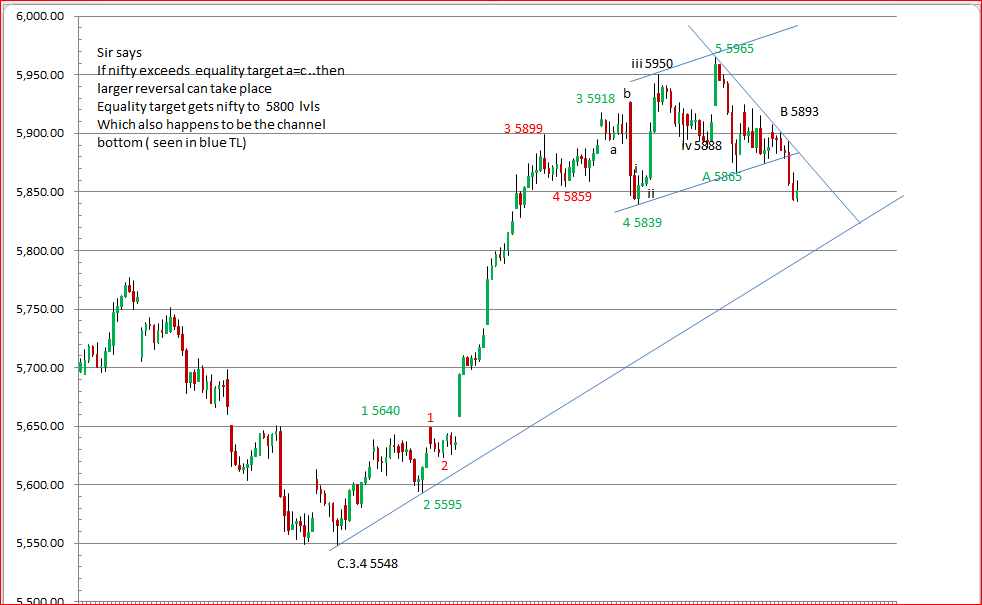
Channel:
There was a channel breakout as well , This was earlier in the day than the above buy signal .
Moving Average:
5Dema at 5697 , so day trend up , now to sustain this up move we need to cross 5627 ( DHema ) and close above it .
We took support at Wema at 5633 .
On day chart , 5 and 10 ema are poised for a Fast rise ,
Fibonacci Retracements:
|
FIBO. RETRACEMENT TABLE |
|
|
|
|
| From |
To |
Fall/ Rise |
0.236% |
0.38 |
0.50 |
0.618% |
0.736% |
0.80% |
| 5815 |
5637 |
178 |
5,679 |
5,705 |
5,726 |
5,747 |
5,768 |
5,779 |
| 5637 |
5720 |
(83) |
5,700 |
5,688 |
5,679 |
5,669 |
5,659 |
5,654 |
|
we have done 38% today and close to 50% , Anything more than 80% at 5779 would mean more upsides .
and Falling below 5654 would mean more downside.
Chart pattern :
It was a Falling wedge , which was forming . This pattern is considered bullish and can be used for indication of a bottom formation .