Hmm , so we break 5255 yesterdays low .
Day low ema at 5280 and we closed below that indicating the trend is down with good momentum now ,
EW wise also ,
2 possibilities that I can see presently ,
Option 1
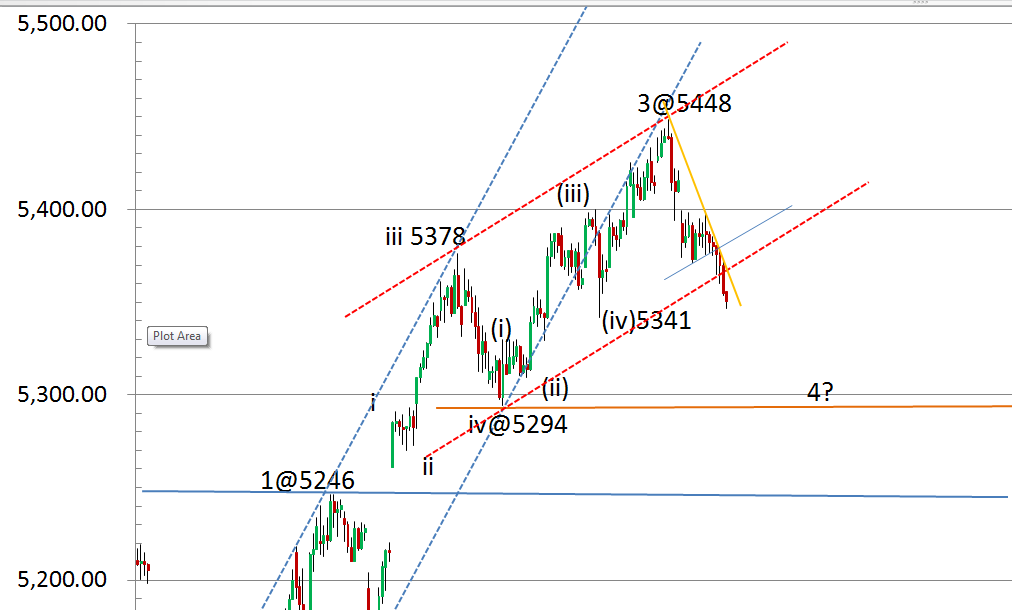
A done at 5255
B On in the form of expanded flat ..this will target above 5340 if this is the case , and comming monday should see this bounce as B.c as long as 5238 is held.
Option 2
A done at 5255
B done at 5340
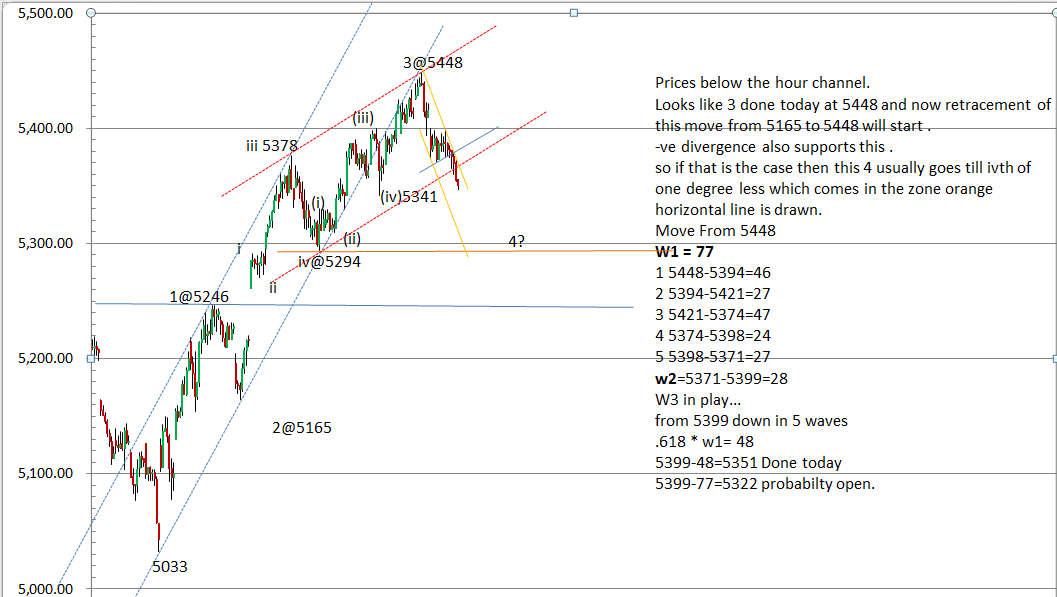
C is on in 5 waves down . If this is the case then Equality to A is what is expected .
we will look for 5 waves to finish to go long now.If accompanained with a +ve divergence and even better.
Divergence :
Hour charts are showing +ve divergence ..but day channel bottom is around 5200 and we closed below day low ema so I will wait it out . I guess till then +ve divergence will ripe .
Happy weekend to All !
Day low ema at 5280 and we closed below that indicating the trend is down with good momentum now ,
EW wise also ,
2 possibilities that I can see presently ,
Option 1
A done at 5255
B On in the form of expanded flat ..this will target above 5340 if this is the case , and comming monday should see this bounce as B.c as long as 5238 is held.
Option 2
A done at 5255
B done at 5340
C is on in 5 waves down . If this is the case then Equality to A is what is expected .
we will look for 5 waves to finish to go long now.If accompanained with a +ve divergence and even better.
Divergence :
Hour charts are showing +ve divergence ..but day channel bottom is around 5200 and we closed below day low ema so I will wait it out . I guess till then +ve divergence will ripe .
Happy weekend to All !