Divergence trades , no wonder give good gains ...but may take long to develop . Live example is what we are seeing now on charts .
Posting a hour chart look for over a week now this -ve divergence is persisting ...

And now look at this Day chart with 9 Rsi ...

We see how a divergence is taking time to form in day charts ...Last reading on RSI was 97.4 , prices have already made a higher high , its time to watch if RSI also makes a higher high or it turns before that . If it does that then this divergence will get confirmed in day charts .
Piyush Sharda ji at Just nifty explains it as
" divergence are decrease in momentum. decrease in speed if u talk in parlance of a car. decrease in speed doesnt mean it will reverse. it can stop and go back in same direction again and make one more divergence.if a week -ve divergence has to develop just think how many hour divergence has to fail for that. if month divergence develops in 2003-08 market many day and week divergence will fail "
Posting a hour chart look for over a week now this -ve divergence is persisting ...

And now look at this Day chart with 9 Rsi ...
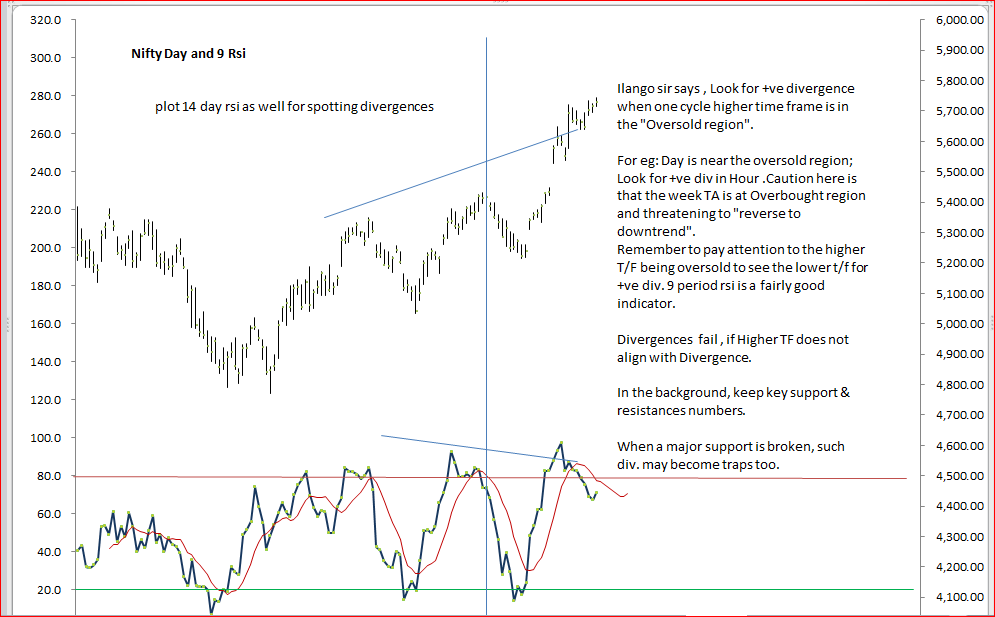
We see how a divergence is taking time to form in day charts ...Last reading on RSI was 97.4 , prices have already made a higher high , its time to watch if RSI also makes a higher high or it turns before that . If it does that then this divergence will get confirmed in day charts .
Piyush Sharda ji at Just nifty explains it as
" divergence are decrease in momentum. decrease in speed if u talk in parlance of a car. decrease in speed doesnt mean it will reverse. it can stop and go back in same direction again and make one more divergence.if a week -ve divergence has to develop just think how many hour divergence has to fail for that. if month divergence develops in 2003-08 market many day and week divergence will fail "
No comments:
Post a Comment