Close at 5287.8
Day TF trending down with a close below DLema
and so is Hour TF .
With todays close week trend turns down as well .
I see +ve divergence in hour charts with Hour TF indicators OS....

 RSI is yet to reach the OS region , so probably more downside to be seen .
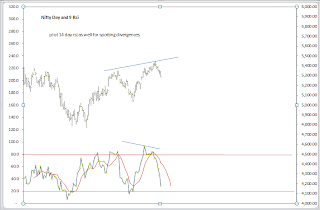
We are in downtrending channel ,

Longs if and when
Break of yellow TL upside probably happens along with day 9 rsi in OS region ( less than 20) and good +ve divergence in hour charts .
Untill then shorts .
Day TF trending down with a close below DLema
and so is Hour TF .
With todays close week trend turns down as well .
I see +ve divergence in hour charts with Hour TF indicators OS....

But sir says ,
"Look for +ve divergence when one cycle higher time frame is in
the "Oversold region".
For eg: Day is near the oversold region; Look for +ve div in Hour .Caution here is that the week TA is at Overbought region and threatening to "reverse to downtrend".
For eg: Day is near the oversold region; Look for +ve div in Hour .Caution here is that the week TA is at Overbought region and threatening to "reverse to downtrend".
Remember to pay attention to the higher T/F being oversold to
see the lower t/f for +ve div. 9 period rsi is a fairly good
indicator.
In the background, keep key support & resistances numbers.
When a major support is broken, such div. may become traps too"
In the background, keep key support & resistances numbers.
When a major support is broken, such div. may become traps too"
So lets see the 9 rsi day chart ,

We are in downtrending channel ,

Longs if and when
Break of yellow TL upside probably happens along with day 9 rsi in OS region ( less than 20) and good +ve divergence in hour charts .
Untill then shorts .
| FIBO. RETRACEMENT TABLE | ||||||||
| From | To | Fall/ Rise | 0.00236 | 0.38 | 0.5 | 0.00618 | 0.00736 | 0.008 |
| 5033 | 5448 | -415 | 5350.06 | 5290.3 | 5240.5 | 5191.447 | 5142.56 | 5116 |
| 5165 | 5448 | -283 | 5381.212 | 5340.46 | 5306.5 | 5273.049 | 5239.712 | 5221.6 |
No comments:
Post a Comment