If we can study Elliott wave along with Momentum , it will help us identify the begining and ending of waves .
How to Gauge momentum ? .
A very simple way to gauge momentum is to watch the price action against moving average .
Short term moving average of period 5 / 10 / 20 .
Medium term Moving average of period 25 / 50 / 100 .
Long term Moving average of period more than 100 / 200 .
If prices are trading above , then strength and if they are trading below then weakness for that respective timeframe.
One can chose hour , day , week or month TimeFrame.
When 5 period ma is above 10 , which is above 20 , then there is strength in the upward direction and vise versa .
In other words whenever short term moving averages are above the long term moving averages the momentum is UP and vise versa .
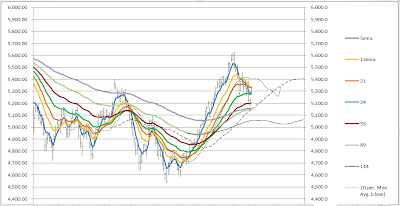
Presently Hour chart shows the various moving averages as

How to Gauge momentum ? .
A very simple way to gauge momentum is to watch the price action against moving average .
Short term moving average of period 5 / 10 / 20 .
Medium term Moving average of period 25 / 50 / 100 .
Long term Moving average of period more than 100 / 200 .
If prices are trading above , then strength and if they are trading below then weakness for that respective timeframe.
One can chose hour , day , week or month TimeFrame.
When 5 period ma is above 10 , which is above 20 , then there is strength in the upward direction and vise versa .
In other words whenever short term moving averages are above the long term moving averages the momentum is UP and vise versa .
Presently Hour chart shows the various moving averages as

Prices have closed above 5 20 and 50 period moving average ...indicating ST strength UP . Also see , 5 period and 50 period moving average are almost at the same level . Now a crossover will be bullish and if 5 period ma starts to fall , it will result in Fast fall .
Day TF moving averages are presently as
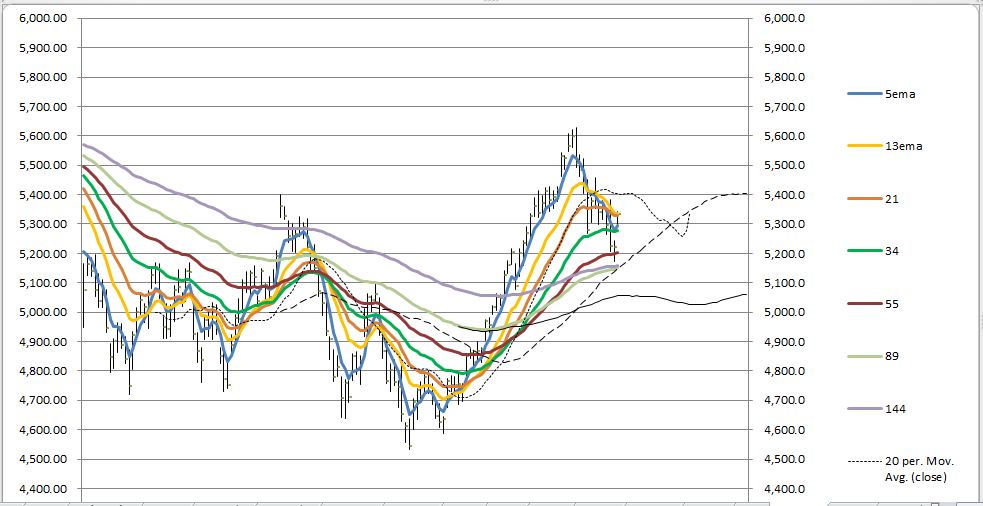
5 period ma touched the 34 period ma and moved up . If this continues then a fast rise in day TF .
No comments:
Post a Comment