This is my trading file to organise and jot down my take on the market .I do Technical Analysis. This blog is to keep track of my baby steps so that I can look back at my journey .Looking back tells me how far I have come from days when I knew nothing and can go further .It gives me motivation to keep going on even when I am tired. One has to back up trading with their own studies. The charts I post here are 99% inspired from Ilango sir.


Monday, 17 December 2012

EOD 17/12/12

 
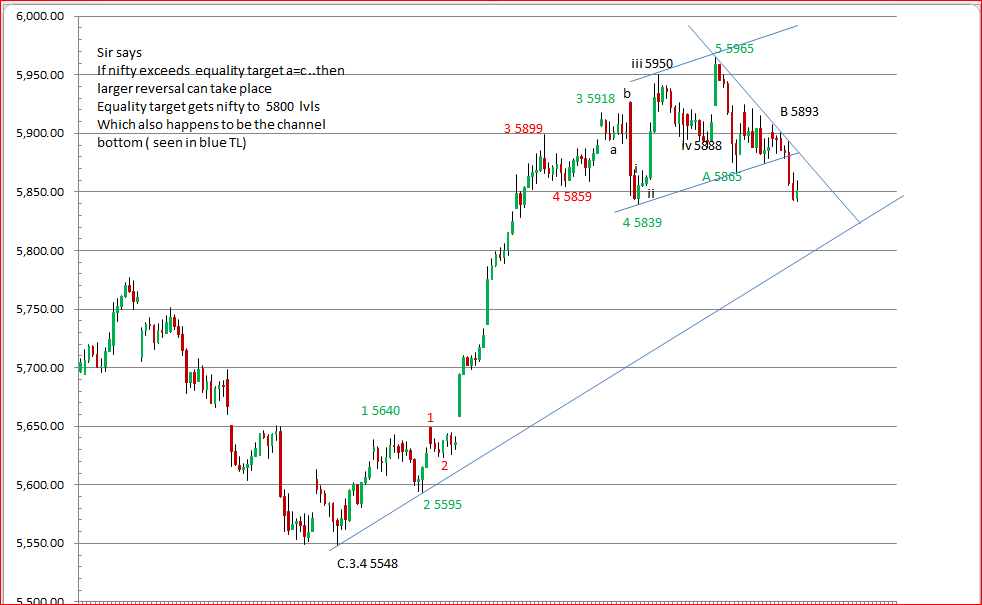
Do we have a Rounding top formation with TL at 5839 break of which might target 5700 lvls?
 

Fast Rise or Fast fall is coming ...as averages will give the direction

5 sma 5860
20 @ 5866
100 @ 5862


Thursday, 13 December 2012

EOD 13th Dec 2012

Trend is down with momentum with a close below DLema ( 5858)
 
 
Hour Chart
 
 
 100 SMA @ 5828

Wednesday, 12 December 2012

EOD 12.12.2012

 
We closed < 5 Dema , making the day trend down , Sell signal on hour charts as well .
DLema at 5867 with a break of this and close below, sell gets confirmed. 


 Sell signal on day charts issued with the divergence  .


EW wise I feel we are still in corrective to fall (5965-5865) , IF 5865 breaks that wud be another confirmation of "sell" generated today.

Tuesday, 11 December 2012

EOD 11th Dec 2012


My HW for the day , read once more about characteristics of impluse waves with guidelines make notes .

Day trend intact with a close > 5DEma .

Clear 5 waves from the top today at 5965 to 5865 , so for tomorow I am keeping the retracements of this down move handy .


 From   To   Fall/ Rise  0.236%        0.38                 0.50 0.618% 0.736% 0.80%
5965 5865       100    5,889    5,903             5,915    5,927      5,939      5,945


Price > 5945 would mean we are in 5th wave
If we start to retrace from the zone 5927-5945 then might be in C.4 ,
and we will not go below 5348 which is top of C.1

-ve divergence played out well today , a 100 point move.

Monday, 10 December 2012

EOD 10.12.2012

 
On hour TF 5 and 20 mas are at the same point ,fast rise or Fast fall ?

Hour Divergence
 Day Divergence


Friday, 7 December 2012

Wednesday, 5 December 2012

EOD 5th Dec 2012


Back after a long vacation .


EW wise
Wave C from 4770 In 5 waves ..
 
 
And now the last wave 5 from 5548 in 5 waves ...

As I see the hour charts -ve divergence is quite prominently seen between the points 5899 (iii) and top made today at 5918 (v)indicating the 4th wave is on after which final 5th might unfold.

Also to keep in mind is this -ve divergence is seen in hour charts  when indicators are OB in day charts..
 

If we see -ve divergence is developing in day chart as well .It holds or negates , only time will tell giving us clues on its way.


I could only do this much HW .
 

Thursday, 11 October 2012

EOD 11th OCt

Closed at 5708


 Clearly hour trend turns up with momentum and it issued a buy at 5696 at 2:00 , and at 3 close 5-10 +ve crossover also seen .

Channel:
There was a channel breakout as well , This was earlier in the day than the above buy signal .


Moving Average:

5Dema at 5697 , so day trend up , now to sustain this up move we need to cross 5627 ( DHema ) and close above it .
We took support at Wema at 5633 .
On day chart , 5 and 10 ema are poised for a Fast rise ,

Fibonacci Retracements:


FIBO. RETRACEMENT TABLE
 From   To   Fall/ Rise  0.236%        0.38                 0.50 0.618% 0.736% 0.80%
5815 5637       178    5,679    5,705             5,726    5,747      5,768      5,779
5637 5720        (83)    5,700    5,688             5,679    5,669      5,659      5,654
we have done 38% today and close to 50%  , Anything more than 80% at 5779 would mean more upsides .

and Falling below 5654 would mean more downside.

Chart pattern :

It was a Falling wedge , which was forming . This pattern is considered bullish and can be used for indication of a bottom formation .


Wednesday, 10 October 2012

EOD 10th Oct 2012

Close ( 5652) Well below the DEma ( 5692) and below the DLema ( 5674). Trend is down with momentum .
We have a sell on day TF now with Sell on hour TF .


Is that a Head and a shoulder pattern ? We will know tomorrow for sure .

+ve divergence developing on hour TF and we have closed at support lvl of 5650 .
Support with +ve divergence may give a upmove ..

Week trend is up , If we get a buy in hour TF now , with Weak trend up , it could be valid buy if it triggers in Day TF also following the hour TF .

HLema at 5655
Dlema at 5674.

Hour ema s , 20 and 100 are right at 5690 , tomorrow will tell if there is -ve cross Or a fast rise ...


Tuesday, 9 October 2012

EOD 9th Oct. Indecision !!

EW on hour TF .Looks like in a falt correction 3 3 5 because we see 3 waves down from 5815 high  , from 5815 off which "a" done at 5666 now "b" is on . This count gets invalidated if we break 5666.
 Candl
 

 On hour TF we have closed right at 5Hema  (5705), below HHema (5714)and above HLema(5695) . Same in Day TF
Closing is below 5 Dema (5712) , trend is down  but as the closing is above DLema(5687) , the downward momentum is not present.

I think any move beyond 5715 and closing above it may indicate that we are in B.c of Flat to lvls close to 5815 ...
and Breaking of yesterday's low at 5666 , would indicate that more lows .


Candle stick pattern :
We may call this a Spinning top which along with yesterday's candle makes a " Bearish Hamrami"
Spinning top indicates indecision .