This is my trading file to organise and jot down my take on the market .I do Technical Analysis. This blog is to keep track of my baby steps so that I can look back at my journey .Looking back tells me how far I have come from days when I knew nothing and can go further .It gives me motivation to keep going on even when I am tired. One has to back up trading with their own studies. The charts I post here are 99% inspired from Ilango sir.


Tuesday, 9 October 2012

EOD 9th Oct. Indecision !!

EW on hour TF .Looks like in a falt correction 3 3 5 because we see 3 waves down from 5815 high  , from 5815 off which "a" done at 5666 now "b" is on . This count gets invalidated if we break 5666.
 Candl
 

 On hour TF we have closed right at 5Hema  (5705), below HHema (5714)and above HLema(5695) . Same in Day TF
Closing is below 5 Dema (5712) , trend is down  but as the closing is above DLema(5687) , the downward momentum is not present.

I think any move beyond 5715 and closing above it may indicate that we are in B.c of Flat to lvls close to 5815 ...
and Breaking of yesterday's low at 5666 , would indicate that more lows .


Candle stick pattern :
We may call this a Spinning top which along with yesterday's candle makes a " Bearish Hamrami"
Spinning top indicates indecision .


Monday, 8 October 2012

EOD 8th Oct

So finally the -ve divergence is confirmed with prices going down below 5 Dema and closing also confirming the loss of  momentum and bearish engulfing also confirmed.

Down move from 5815 is a 3 wave structure till now , 
from 5815
a 5815-5706=109
b 5706-5752=46( 42.2%)
c* going on T1=.618(a)=67 pts =5684 ( We have already done this today ) T1=a=5643 If we go beyond 1.618 % of a downside then we will have to count 5 waves from 5815 down .

We presently have sell on day TF as  well along with hour TF .
 

Friday, 5 October 2012

EOD 5th Oct 2012

Let me start with 9 RSI day chart .. where I see the -ve divergence has formed well and showed its effects today .
 
Macd Histogram divergence


But again we have closed at 5747,  above 5 day ema at 5735 .
Trend still intact , though momentum is not there now , with a close below day high ema .

Safe shorts would be only below a close of 5 dema .


Candle pattern wise we have a Bearish Engulfing today , which is there after a good uptrend along with weakening of momentum . Candle formed today engulfs the shadow also ,


Confirmation in the form of further weakness needed on Monday . On day charts SS has not crossed the trigger line yet , with a cross of trigger line , shorts would be safer.

Probably it may come with a close below 5 day ema .


Retracements for todays fall from 5810 to 5706 are

 From   To   Fall/ Rise  0.236%        0.38                 0.50 0.618% 0.736% 0.80%
5810 5706       104    5,731    5,746             5,758    5,770      5,783      5,789

Prices going above 80% would mean strength ...


we have done close to 50 % today at 5758.

All in all  , A bearish engulfing + losing momentum on Day TF + -ve divergnece persisting on day charts .
 

Thursday, 4 October 2012

EOD 4th Oct 2012

-ve divergence persisting in Hour TF and still developing in day TF as follows

 
Day TA is OB and -ve divergence presently , last RSI high at 97.4 , if with prices making HH RSI goes above 97.4 then -ve divergence vanishes . If not now is no time for shorts one has to wait it out . I am not available tomorow to trade .If it comes then I will miss it .

5 Day ema at 5729 , weakness only below this . Other #s to watch
Today's low at 5751.55 and Day high ema at 5747.

Presently prices showing no weakness.
EW

Accordingly we still have (iv) (v) to do within iii , where iii will be over and then iv and v to complete the 5th wave . That would complete the 5 waves and then correction . IFF during all this process the -ve divergence persists with Day TA , OB we will get a golden opportunity to short for good gains . As the correction will be for the move from 5216 to the new high of 'C'.


Divergence

Divergence trades , no wonder give good gains ...but may take long to develop . Live example is what we are seeing now on charts .
Posting a hour chart look for over a week now this -ve divergence is persisting ...


And now look at this Day chart with 9 Rsi ...


We see how a divergence is taking time to form in day charts ...Last reading on RSI was 97.4 , prices have already made a higher high , its time to watch if RSI also makes a higher high or it turns before that . If it does that then this  divergence will get confirmed in day charts .

Piyush Sharda ji at Just nifty explains it as

" divergence are decrease in momentum. decrease in speed if u talk in parlance of a car. decrease in speed doesnt mean it will reverse. it can stop and go back in same direction again and make one more divergence.if a week -ve divergence has to develop just think how many hour divergence has to fail for that. if month divergence develops in 2003-08 market many day and week divergence will fail "


Wednesday, 3 October 2012

4th Oct 2012

-ve divergence persisting in the hour charts ..

 
Prices making  higher tops and macd is making lower highs as seen in the charts . -ve divergence persisting since  5650 as marked in the charts .But prices are maintaing the close near the highs and above Day Ema and DHEma ..I have already lost  a few points trying to trade this divergence  ...Now no shorting till we get a close below DEma presently at 5699.
21 Hr Ema at 5714.
34 Hr Ema at 5700.
Hour low ema I feel is susptible to whipsaw , so putting my trust with 21 / 34 hr ema and Day Ema .
Below 5700 weakness and confirmation of -ve divergence . One more Confirmation could be Fast Macd crossing zero line on Hour TF .

Monday, 1 October 2012

3/10/2012

Closed at 5719.

At  HHema ( 5719)

Hour trend up  .

Above Dhema ( 5705) ,  Day trend up with momentum .

Now we have First Hour low ema at 5707 and Day high ema at 5705 . SO only a close below these lvls would bring weakness in price.

-ve Divergence in hour charts still persisting.

All I understand is 5735 is resistance presently .
and 5700-5710 support.

5Dema being at 5683.

Friday, 28 September 2012

1/10/2012

Price wise , unless we close first below 5699 ( HLema ) , no momentum in hour trend which is down presently .

Day trend is up with momentum with a close above 5696( DHema ).

Week Trend stays up and so is the month .

Shorts only when , we close below the hour low ema with a 5-10 -ve crossover . Hour charts showing -ve divergence with peaks 5720 and 5735.
confirmation comes with a close below 5565 is Day ema , weakness only below this .

EW wise , I feel we have done 5 waves at 5720 and are in an irregular correction presently , with 'b' shooting over 5 today at 5735. We will see a 'c' wave if we are in irregular flat from 5720 , which should take us below 5638 . Indication of this possibility will come , with weakness in price as stated above.

Divergence : Hour charts showing -ve divergence with peaks 5720 and 5735.

Indicators :

macd ( 34 5 5) on hour TF has given a sell today . Candle pattern wise , there  is a stooting star today .

Indicators , EW , Candle pattern , developing -ve divergence on hour charts.showing bearish possibility  , But the prices are firm and are not showing any weakness in Day TF , Though they are down in hour TF , but are closing above Hour low ema . The min requirement is to close below the HLema which is presently at 5699.

Tuesday, 25 September 2012

26/9/2012

Day chart has a Doji today , Whole day it was range bound , I did short the market today as prices closed below Hour Low ema , at 12 noon . But then they decided to take support at 5655-5650 zone and bounced . SL was channel top which was first around 5695 and which slowly moved down , Finally there was Dip to 5666 during the last hour and I closed my position there with a loss of 7 points , Phew !!

Did not carry any positions as a corrective is going on ..and moreover I am not available tommorow .

What do the charts say to Me , here it is ...
We  are in corrective move presently ,
Now Q is whether we are correcting the move from

5216 to 5720 ( 5 waves over at 5720) or move from 5333 to 5720 ( assuming only 3 waves done at 5720 and one more top above 5720 as 5th wave )  ...lets look at the Fib retracements ...

If it is correction for 5216 to 5720 then this present correction should me more than what 2 and 4 have done


So more than 113 comes to below 5607 and the path can take form of a Flat , zz or a triangle.
Fib ret can be seen in the table below .


 From   To   Fall/ Rise  0.236%        0.38                 0.50 0.618% 0.736% 0.80%
5537 5720      (183)    5,677    5,650             5,629    5,607      5,585      5,574
5333 5720      (387)    5,629    5,573             5,527    5,481      5,435      5,410
              -             -             -                     -             -             -             -  
5216 5720      (504)    5,601    5,528             5,468    5,408      5,349      5,317


 And as per option 2 if only 3 waves are done at 5720 then we are correcting the 3rd wave which started form 5333.Again since this is correcting the whole move from 5333 , then the correction should be more than subwave ii and iv which again comes to below 5607.


Price wise we have closed above 5 Dema at 5637 and Also above 5 D hema at 5666 , so day trend is up with momentum .
Hour trend is facing correction  , but have closed above Hlema at 5667 . So hour trend down without momentum .
 Price wise no weakness .
BUT
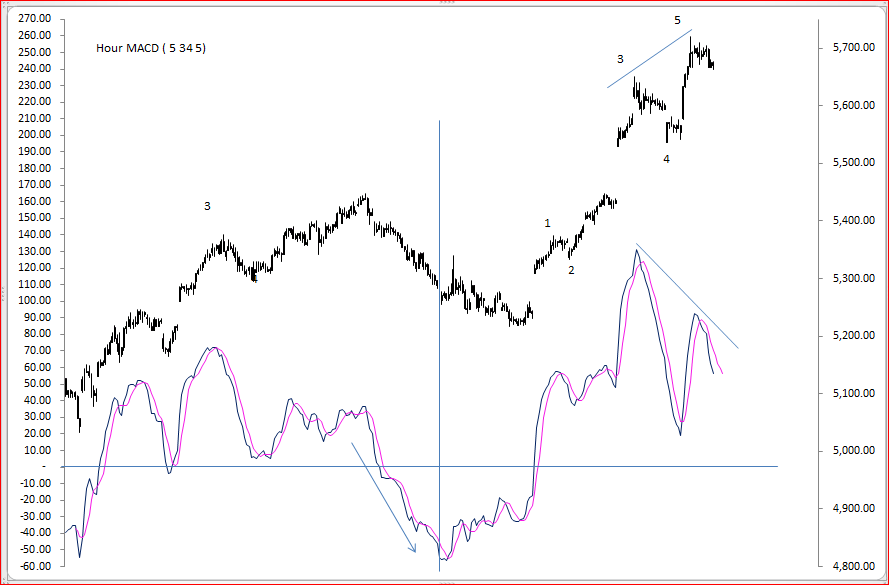
-ve divergence still there in hour charts , with macd ( 34 5 5) in sell mode . This sell will negate if this macd shows a +ve crossover.
5 sma and 20 sma are poised interestingly ,  it may give a Fast rise / Fast fall .


Have a nice day !
 

Monday, 24 September 2012

25th Sep 2012

We closed at 5669.6

Hour trend down with a close below hour 5 ema ( 5677) , hour low ema at 5669 , a close below this would bring down momentum in hour TF  .

Day high ema at 5648 5 day ema far below at 5618

-ve divergence prominent on hour charts ...with a sell triggered today with a cross over of macd ( 34 5 5). But again , Day high ema is at 5648 unless we close atleast below that ,this is just a correction IMHO.


Still vth of 5th pending . lets see if that comes next trading session , or more weakness