This is my trading file to organise and jot down my take on the market .I do Technical Analysis. This blog is to keep track of my baby steps so that I can look back at my journey .Looking back tells me how far I have come from days when I knew nothing and can go further .It gives me motivation to keep going on even when I am tired. One has to back up trading with their own studies. The charts I post here are 99% inspired from Ilango sir.


Monday, 3 September 2012

Eod 3rd Sep.2012

Things to watch ,
We ended with a insiders day with a close at 5253.75


Day 9Rsi is OS being below 20 , and there is a +ve divergence in hour charts .


With a close below Day low ema , we are trending down with momentum .
If this +ve divergence has to play then , without getting negated , we will get a close above Day low ema ( 5268) as first sign.
presently day channel bottom at 5205 lvls.


Did go long in the morning , thinking a bounce will come as last leg of wave B , but came out as the day low was broken .
 

Friday, 31 August 2012

EOD 31st August2012

Hmm , so we break 5255 yesterdays low .

Day low ema at 5280 and we closed below that indicating the trend is down with good momentum now  ,

EW wise also ,
2 possibilities that I can see presently ,
Option 1
A done at 5255
B On in the form of expanded flat ..this will target above 5340 if this is the case , and comming monday should see this bounce as B.c as long as 5238 is held.

Option 2

A done at 5255
B done at 5340
C is on in 5 waves down . If this is the case then Equality to A is what is expected .
 we will look for 5 waves to finish to go long now.If accompanained with a +ve divergence and even better.


Divergence :

Hour charts are showing +ve divergence ..but day channel bottom is around 5200 and we closed below day low ema so I will wait it out . I guess till then +ve divergence will ripe .

Happy weekend to All !

Thursday, 30 August 2012

31st August 2012

EW from 5033 with Macd( 5 34 5)


For the move from 5033-5448 , We may have done 1st corrective A at 5255 today as this is a 5 wave , probability of this corrective to be ZZ is there , and now B is on which should be 3 waves in all followed by C which will be 5 waves  .Retracement for this B can be

From To Fall/ Rise 0.00236 0.38 0.5 0.00618 0.00736 0.008
5448 5255 193 5300.548 5328.34 5351.5 5374.313 5397.048 5409.4

Trade plan :

Buy as close to 5255 as possible for B wave up or If RR does not favor then , wait out and
 at  61.8% 5374 to 73.6% 5397can be a good entry for shorts with 5410 SL ( more than 80%) .All this provided 5255 is not broken .

Trend :
Close at 5315

Hour trend turns up with momentum , with a close above hour high ema 5305
Day Ema at 5331 , Day high ema at 5365 .
Weekhigh ema 5376 can act as resistance , for this upmove if it is B and As long as 5255 is not broken towards down .

Wednesday, 29 August 2012

30 august 2012

Close at 5287.8

Day TF trending down with a close below DLema
and so is Hour TF  .
With todays close week trend turns down as well .

I see +ve divergence in hour charts with Hour TF indicators OS....

 
But sir says ,
"Look for +ve divergence when one cycle higher time frame is in the "Oversold region".

For eg: Day is near the oversold region; Look for +ve div in Hour .Caution here is that the week TA is at Overbought region and threatening to "reverse to downtrend".
Remember to pay attention to the higher T/F being oversold to see the lower t/f for +ve div. 9 period rsi is a fairly good indicator.

In the background, keep key support & resistances numbers.

When a major support is broken, such div. may become traps too"
So lets see the 9 rsi day chart ,
RSI is yet to reach the OS region , so probably more downside to be seen .


We are in downtrending channel ,


Longs if and when

 Break of yellow TL upside probably happens along with day 9 rsi in OS region ( less than 20) and good +ve divergence in hour charts .

Untill then shorts .


  FIBO. RETRACEMENT TABLE              
From To Fall/ Rise 0.00236 0.38 0.5 0.00618 0.00736 0.008
5033 5448 -415 5350.06 5290.3 5240.5 5191.447 5142.56 5116
5165 5448 -283 5381.212 5340.46 5306.5 5273.049 5239.712 5221.6


Tuesday, 28 August 2012

29th August 2012

 
  FIBO. RETRACEMENT TABLE              
From To Fall/ Rise 0.00236 0.38 0.5 0.00618 0.00736 0.008
5421 5313 108 5338.488 5354.04 5367 5379.766 5392.488 5399.4

 
we did 5343 today . If this was 3rd down to be followed by 5th then 5379 would be a good point to sell again , with 5400 as SL . If we move past 5400 then correction would be assumed over at 5313 for now . Anything above/below 80% is strength/weakness.
 
Channels
Downtrending channel is intact.

Trend remains down with momentum as closed below DLema .


20 crossed 50 today to down and now to watch is combination of 20 and 100.


Monday, 27 August 2012

28th August 2012

We closed at 5350.25

Moving Average:
Hour trend was down , already and though we were closing above HLema for almost all day , around the last hours not only closed below the hour low ema , but DLema as well making the Day trend down with momentum .
Day low ema 5363 .


Keeping a watch on yellow UTL will be my guide .


EW lables can be seen as in the following chart.


Keeping a watch on 20 / 50 ema as well , they are at the same value resently , change in value with respect to each other may guide further .

  FIBO. RETRACEMENT TABLE              
From To Fall/ Rise 0.00236 0.38 0.5 0.00618 0.00736 0.008
5033 5448 -415 5350.06 5290.3 5240.5 5191.447 5142.56 5116
5399 5347 52 5359.272 5366.76 5373 5379.146 5385.272 5388.6

Sunday, 26 August 2012

27 August 2012


Day and Hour Channels ,

Still  well within the day channel, Hour channel is broken ,
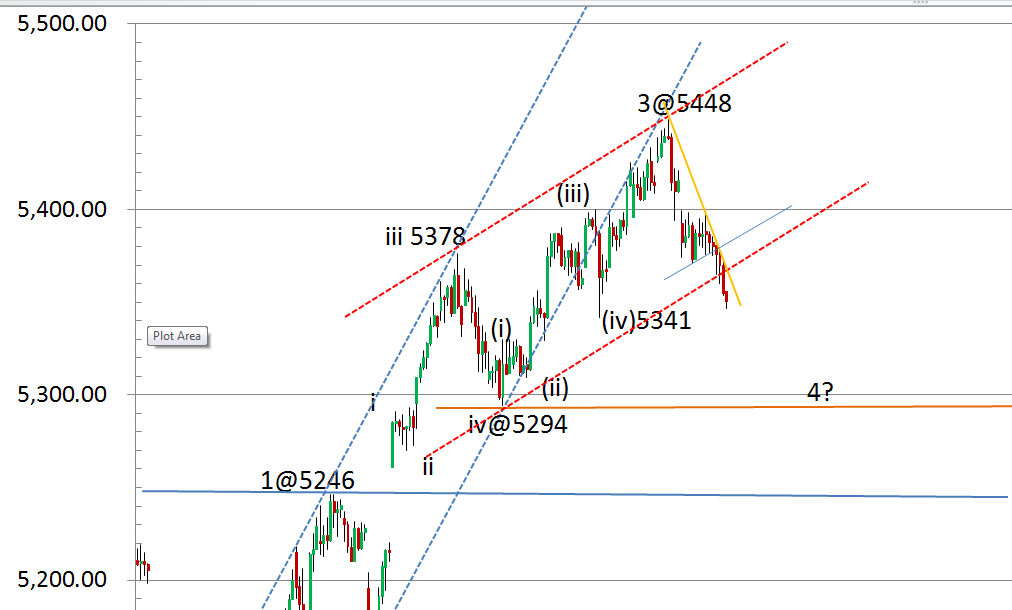
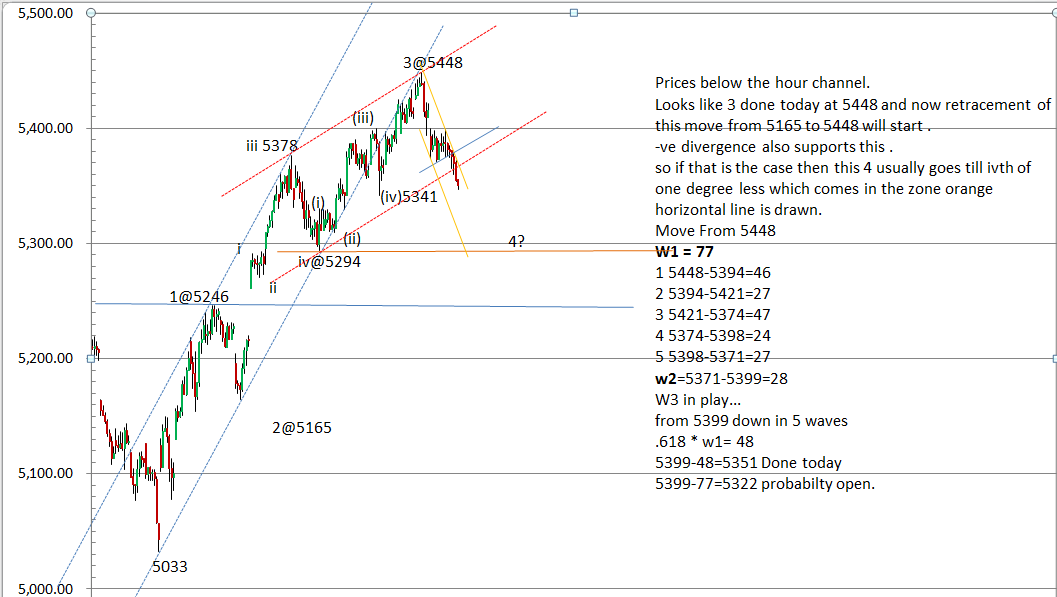
last falls from 5246 -5165 was 81 points , from 5378-5294 was of 84 points and from high of 5448 we have already done a fall of 77 points till 5371 anything more than 5364 downside  ( 5448-84) means the falls would be deeper .
 Also 80% of last rise comes to 5363 ,and  break of 80% warns you of more downside..new lows . Last low before we turned up was 5341.

 If prices take support at 5360-5370 zone , then HH is possible  , taking into consideration that day channel is yet intact and the bottom of channel  is far from where prices are trading now .

Thursday, 23 August 2012

EOD 23rd August

Retracement for the fall from 5448 to 5394  comes at

From To Fall/ Rise 0.00236 0.38 0.5 0.00618 0.00736 0.008
5448 5394 54 5406.744 5414.52 5421 5427.383 5433.744 5437.2

We have done 5419 already today close to 50% .

Day Trend is up having lost the momentum with today's close below high ema .
and Hour trend has turned down today withour momentum , as we closed above low ema.

on Hour TF 5 and 10 ema at 5419 , I will keep my eye on this .

Today's low 5394 , if we break this more weakness according to me .
5398 day ema
5371 day low ema

-ve divergence still persisting .

anything above 5438 means HH .
 

Wednesday, 22 August 2012

EW from 5033-5433


EW folks pls write your inputs .

Trend :

Hour trend is down without momentum  .
Day trend is up with Day high ema at 5407 and a close above it at 5413.

Owing to
  • -ve divergence and
  • ew looks to have completed wave3 today at 5433 and possibility of 4th down now
 I will look for weakness to short, First indication would be a close below hour low ema ( 5407) which is also day high ema.. retracement of last rise from 5342 to 5433 comes as
 From   To   Fall/ Rise  0.236%        0.38        0.50 0.618% 0.736% 0.80%
5342 5433        (91)    5,412    5,398    5,388    5,377      5,366      5,360


Day EW chart.


Tuesday, 21 August 2012

EOD 21st August.


Hour charts are continuing to show -ve divergence

Likewise day charts also are continously showing -ve divergence  .

But my HI lo system says a buy at 10:00 on hour charts  today morning with a close above hour high ema , 34 MA( 30 mins ) with 20 points SL.
If you feel that was risky , then buying on break of 5400 could have also worked today .

The Day trend is up with momentum with a close above Day high ema ,

and the Hour trend is also up with momentum with a close above Hour high ema.
I have no positions as of now .
If divergence has to play out , it will indicate by closing below hour high ( 5409) and then a close below 5 hour ema (5404) , untill then its a buy.
5393 is Hour low ema and Day high ema .