This is my trading file to organise and jot down my take on the market .I do Technical Analysis. This blog is to keep track of my baby steps so that I can look back at my journey .Looking back tells me how far I have come from days when I knew nothing and can go further .It gives me motivation to keep going on even when I am tired. One has to back up trading with their own studies. The charts I post here are 99% inspired from Ilango sir.


Wednesday, 28 March 2012

Personally this week is super busy , Posting here has become a routine life unless I am really occupied or I don't know what to write :) .
I will try my best to post the hour Hi lo ema with 34 ema trades sheet EOD, though I will not be taking any of the trades if genrated ., as I will be away from terminal for rest of this week . Moreover this is expiry week , expected to be volatile .

Tuesday, 27 March 2012

EOD 27th March


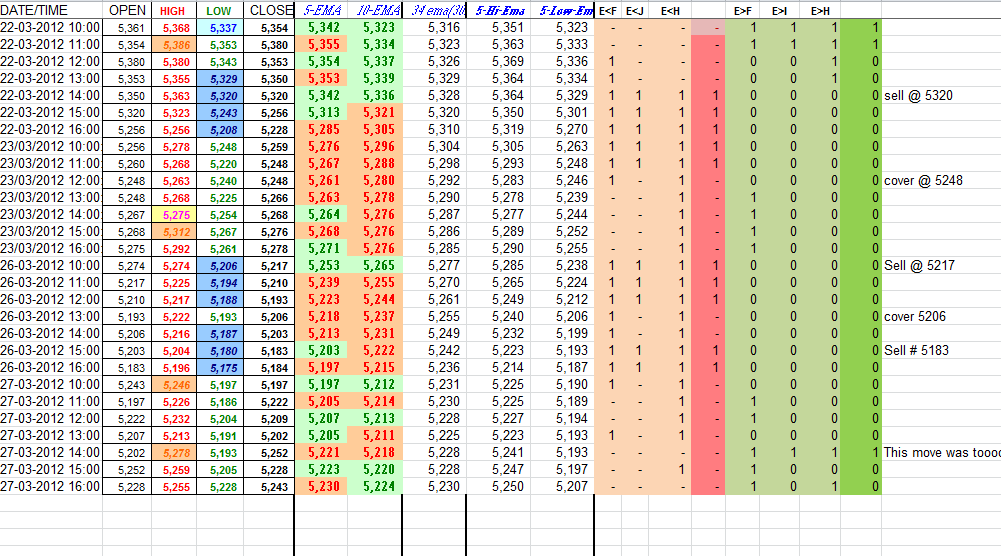
We did close above the reqd conditions at 2:00 . But the move at 2:00 closing was toooo fast , If one would have known to take positions on break of 5230 ( upper trendine of falling wedge)then profitable/Otherwise avoid taking positions during such sharp and fast moves and wait for prices to settle down.

EOD close 5243.15
We did close above 34 ema on 30 min TF and above hour 5 ema  but we did not close above hour high ema ( 5250) . Which does not suggest to take long trade .
We have closed below 5 day ema (5257).
As per me bias is -ve.

Monday, 26 March 2012

Hourly high Low combined with 34 ema on 30 min TF

Link to this excel file is Hi Lo Ema

P:S : I think the background color  in 5 ema 10 ema are not right . but the purpose of post is to combine hour Hi lo with 34 ema on 30 mins TF.


Thursday, 22 March 2012

EW counts on 22nd march

22nd March 2012

some possibilities
Lets see the options we were following

Option 1 gets invalidated according to me at present .

Option 2
We are still in 4th wave and have done A as

W1-- 4531-4800 = 269
W2-- 4800-4588=212 ( .78% of 1)
W3-- 4588-5630= 1042
W4-- Going on
  • A--- 5630-5171= 459
  • B--- 5171 - 5499= 328
  • C going on should do 5 waves to down of which we are done with
C.1 5499-5233=266
C.2 5233-5386=153
C.3 in play will do 5 waves to down ..
i 5386 5329=57
ii 5329-5363=34
iii 5363-5206* 157 points is done already ..clearly it is an extended wave .
iv to up will unfold and as and when it retraces 61.8% it will be good place to go short .


OR Still doing B as a FLAT in 3 waves . In this

Option 3

A--- 5630-5171= 459
B Going on .in 3 waves as a flat...
a 5171-5499 = 328
b 5499 - 5206
Here 90% comes to 5202 ...we have almost done that ...now 'c' up in 5 waves ??

So option 1 suggests that we will soon reverse the direction ,
and Option 2 and 3 suggest more down side .

Lets see how prices unfold

time to sell !

Looking at weakness in prices I feel ,  its time to sell again at 5354
12:50 pm:

11:30 update 22nd march 2012


At 11:30 As we close below hour ema and hour high ema after resisting at cluster resistance zone of 5382-5392 ...This made me come out of longs taken at 5316 .
Now at 12:00 if we close below hour low ema as well ..then that will qualify to take shorts .

Wednesday, 21 March 2012

EOD 21st march 2012


Close at 5365 .

The simplest of trading system says to be Long
Reason :we closed above 5Day ema .


Let me write down the important nos .
5Wema
5Dema
5Hema

Having closed above 5Hema and 5Dema and 5Wema ..The trend is UP in all three Time Frames .

Hour high ema is 5343 and momentum is clearly up in Hour TF.
As we closed above Dlema , " Buy on dips to high ema " has already played out , If prices close above day high ema now , Momentum will be up in Day TF as well and then one can safely hold the longs .

Bullish Zero line crossover :

Fast Rise ?

In day TF 5 ema has again taken a support of 34 ema . 13 and 21 ema almost at the same lvl . crossing these two lvls will be good for longs .
5ema at 5329 and 10 ema at 5337 .

Candle pattern :

i feel today was a  Marubujo  and its meaning A White Marubozu forms when the open equals the low and the close equals the high. This indicates that buyers controlled the price action from the first trade to the last trade.
Lets see what tomorrow brings !

Nifty Day chart.
.

Intraday 21st March

ORB 5267- 5288
It was broken down .
At 10:00 prices closed below day Lema .
and prices closed below the 5hour close ema at 5273 ...
Took a sell position at 5265 with target = 5240 and sl= day high 5287
-------------------------------------------------------------------

Update at 11:45
prices made a high of 5288 for the day then receeded . I took a sell position with reasons mentioned ORB was broken down and also prices closed below 5 hr ema , ( though they were above the hour low ema ) .

Was holding the position as prices were making lower high , so first my SL was 5288 , then moved it to 5284 ...then prices again dropped from this lvl , so then moved it to 5282 .
And then you can see , my SL was hit .
Though nifty spot travelled 20 points from my entry , But I had to give away close to 30 points inNF.

All those who visit me here and feel that I  overlooked "something" , that I should have taken into consideration  pls point it out ..so that our learning can grow.
-----------------------------------------------------------------------------


So High low system tells me to Go long at 1:00 close at 5316 I will keep a stop loss of 20 Points at 5296 . With every hour close we will  move this SL .
At 2:00 close lets move our stop loss to breakeven so that it covers brokerage so at 5321.

Now to 5330.


Tuesday, 20 March 2012

EOD 20th march

Let me start with a day chart where various ema s are plotted ..


Monday, 19 March 2012

I had updated the nifty counts  on last friday  , you can find the link to page on the right side pannel .

Due to my other personal work , my writing here will be occasional , and not daily . More over summer vacations are here :-D ..what more can I say :))

Will continue after this gap .