This is my trading file to organise and jot down my take on the market .I do Technical Analysis. This blog is to keep track of my baby steps so that I can look back at my journey .Looking back tells me how far I have come from days when I knew nothing and can go further .It gives me motivation to keep going on even when I am tired. One has to back up trading with their own studies. The charts I post here are 99% inspired from Ilango sir.


Monday, 12 March 2012

EOD 12th march

5316 5 day ema ...Prices closed 5360 again above 5 day ema and thus day trend is up . 5 day high ema coincidently hour high ema as well at 5368 and close below this suggests weakness in prices to close ema and low ema .

Today we closed above 5 week ema at 5352 ...making the week trend up  for  now but again closed below the week high ema so its not confirmed that week trend is up.

5369 is pivot for tuesday.
Since markets are volatile , ORB along with Pivot lvls can be used to trade Intraday . For last 2 days ORB is guiding well about the direction of trade for the day.

Intraday 12th March 2012

Squared off the long positions .

                                         Open       High        Low         Close       5Ema       10Ema     HH          HL
03-12-2012 10:00          5,420          5,420          5,361          5,374      5,339      5,315      5,359      5,326
03-12-2012 11:00          5,373          5,377          5,352          5,364      5,347      5,324      5,365      5,335
03-12-2012 12:00          5,364          5,379          5,344          5,344      5,348      5,329      5,370      5,338
 ---------------------------------------------------------------------------------------------------------------
At 11:00 close 5364 we closed below the Hour high ema.
showing weakness .
5344 (Close at 11:30) at 12:00 is developing presently.

Sunday, 11 March 2012

Momentum

If we can study Elliott wave along with Momentum , it will help us identify the begining and ending of waves .

How to Gauge momentum ?  .

A very simple way to gauge momentum is to watch the price action against moving average .

Short term   moving average of period 5 / 10 /  20 .
Medium term Moving average of period 25 / 50 / 100 .
Long term Moving average of period more than 100 / 200 .

If prices are trading above , then strength and if they are trading below then weakness for that respective timeframe.

One can chose hour , day , week or month TimeFrame.

When 5 period ma is above 10 , which is above  20 , then there is strength in the upward direction and vise versa .

In other words whenever short term moving averages are above the long term moving averages the momentum is UP and vise versa .


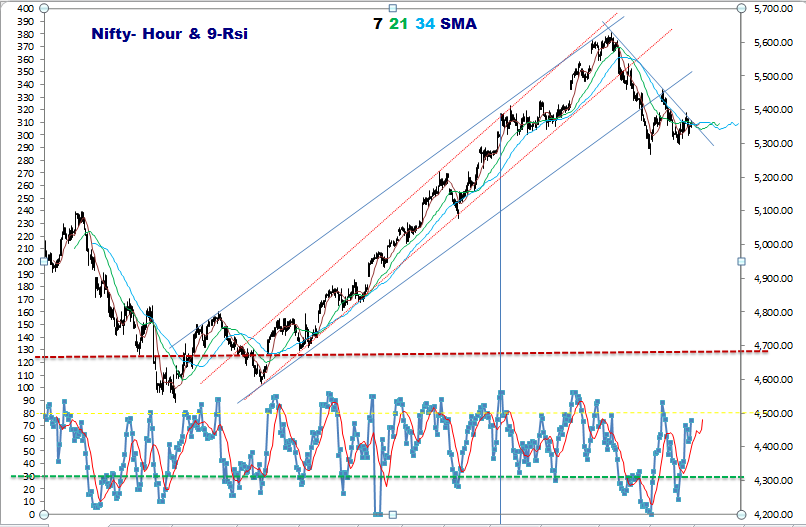
Presently Hour chart shows the various moving averages as


Prices have closed above 5 20 and 50 period moving average ...indicating ST strength UP . Also see ,  5 period and 50 period moving average are almost at the same level . Now a crossover will be bullish and if 5 period ma starts to fall , it will result in Fast fall .

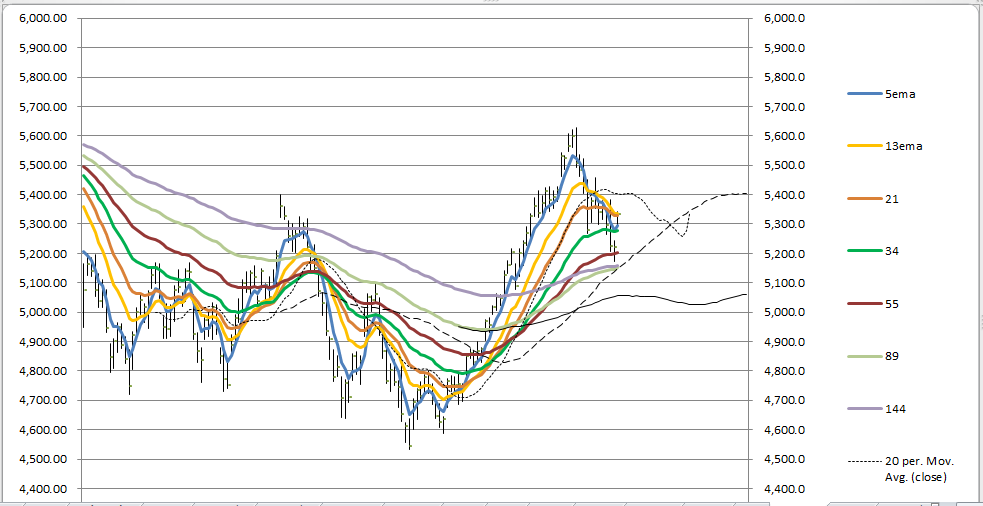
Day TF moving averages are presently as


5 period ma touched the 34 period ma and moved up . If this continues then a fast rise in day TF .


Friday, 9 March 2012

EOD 9th March 2012

We closed at 5334.

Lets look at some important lvls  ,

5323   5Hour ema
5329   Hour Hema
5258   Day Lema
5294   5 Dema
5342   DHema
5348   5Wema
5323   Monday Pivot.
5326  10 Dema
5329  21 Dema
5277  34 Ema

So we closed above most of these important lvls , except the DHema ( 5342) and 5Wema ( 5348) this is keeping the weekly trend still Down , But with todays close the Hour and Day trend are UP.

Moving Average:

If one takes position with hourly close then 10:00 close gave a buy signal today at 5313 in the morning with a close above hour high ema , but then it was a good Gap up as well ...so took support of  ORB as well. This also gave a buy signal as it broke it to upper range.

Divergence :

Take a look at the chart below ....


Starting 9th March

We are opening at 5294 gap up from 5220 .

The JNSAR is at 5344 .
We have opened above R2 for the day at 5282 ...Also opening is at 34 hr sma , if we trade above this lvl then bias for day is up .

I feel today ORB will be a good guide  .
 Aggresive Trade will be to go long now at 5303 ..with R2 as Stop loss.

Tuesday, 6 March 2012

EOD 6th March

As I see the various indicators , the one that caught my eye was Hour slow macd with a positive divergence .

Moving Average:

Dema is at 5302 we clsoed well below that at 5222.
Day TF trend down
Hour TF trend down .
Pivot is at 5297 .

Channels :


As and when we break upper trend line of blue channel and close above it we can say we are in 5th wave up .

we have done the 38.2% of rise from 4588-5630 at 5231 ...now next is 50% at 5108.
Looking at the length of A from 5630 - 5268= 362
 If feel we have more room to go down as C . If one gets an opportunity , short with a close above hour high ema as SL.

Starting 6th March 2012


Keeping an eye on 50 and 200 sma for fast rise ...
If 50 now starts to rise ..then fast rise will materialize .

Update at 10:00
we closed at 5296 ..and Hour High ema at 5313 ..so did not take long position .One could have taken long at the break of pivot at 5297 though.
waiting and watching
***********************

We opened weak and touched and went beyond the 38.2% retaracement of the fall from 4588 - 5630 which is at 5231 ...we have done the requisite for the 4th wave ...we can be very well in the 5th wave to up

As wave 2 was deep , wave 4 has to be shallow .
34 D ema is at 5280 and now trading above 5300 ....If at 10 we close above this 5280 then upmove .

5302 is HHema , if we close above this as well then Buy on dips comes in picture .
5278 HLema

Monday, 5 March 2012

EOD 5th March

5Dema 5341 ,
5Hema 5289 ,
5Lema 5278,
Day pivot 5297,
21 hr MA 5325,
34 Hr Ma 5348,
10 DEma TF 5373
DayLema 5309.

.


We closed above HLema but below HHema and 5HrEma.
Very Important that we close below day L ema at 5309 .
indicating downside .
34 Dema , very important moving average , is at 5280 , Opening itself  will tell if weakness or strength ?


Looking at the day chart , It looks to me like 4th wave on in a ZZ (A B C ) . A and B done and now C going on in 5 waves down .


Moving Average:

For any upmove we have to close above 5341 the 5 DayEma .

Channels :

Upper green channel still intact , break of the channel upside will indicate that we are done with wave 4 and are in wave 5 which will go min = wave 1

Fibonacci Retracements:

5231 38.2% of 4588-5630
5108  50% of 4588- 5630

Look at this 9 Hr rsi chart ...RSI has made a triangle . I also see small +ve divergence .Is 4th wave coming to an end ? and 5th to start

Conclusion :
todays close is 5280. Break out of Range from 5275-5300 ,will give direction for trade tomorow .

Plan for 5th March

Did go short as per the plan with one lot of mini nifty(20) ...watched plus and minus in the account ..and at a point had strong urge to square off with having 20 points profit ...but then held and then watched the pointer go up again .  In 2 min TF prices broke the 34 period MA and closed above it  , was watching 5 min TF carefully and prices started to touch 34 period ma there also ..so came off  at the price entered bearing loss of  brokerage cost .

Leasons learnt today ....
  • I should have waited for the prices to close above the 34 period ma , before squaring off   .
  • I should have taken 2 lots so that , could have booked 20 points on 1 lot which could have fetched me brokerage + , keeping my capital preserved , while holding on to the 2nd lot .
  • Preserving capital is the main goal  , so that i can play for Long .
  • Intraday 20-30 points is good for me .

+++++++++++++++++++++++++++++++++++++

ORB for today is 5303-5345

breaking 5297 as per last post will suggest that we are in 3rd wave down of C .
Prices are trading below Hour 5 ema and HLema ( 5339) .
10:00 close will also give a clue and also if
If ORB is broken down before 10:00 , I will go short for the day , with a small sl and a small target.

Friday, 2 March 2012

EOD 2nd March 2012


I have drawn 2 yellow lines to denote the range of Big bar that covers next four days candle ...so  any move past these two lvls will suggest the course prices may take .


Today prices resisted at the upper Blue trendline ...


A triangle under formation ?
 
or Are we in C ? with B over at 5459 off which 1 and 2 done 3 will unfold ..if that happens we will break 5324 first then 5310 then finally 5297 ...break of 5297 will suggest that sub 5200 lvls will be touched .

Day trend still DOWN with a close below 5 day ema .

moving averages alinged , giving no clear signal ...If prices from here move up and 20  starts to rise it will be fast rise and if cross over takes place then we go DOWN.

Also short term moving averages are converging on hour chart ...break of  either 5459 or 5298 will give good gains on that side .