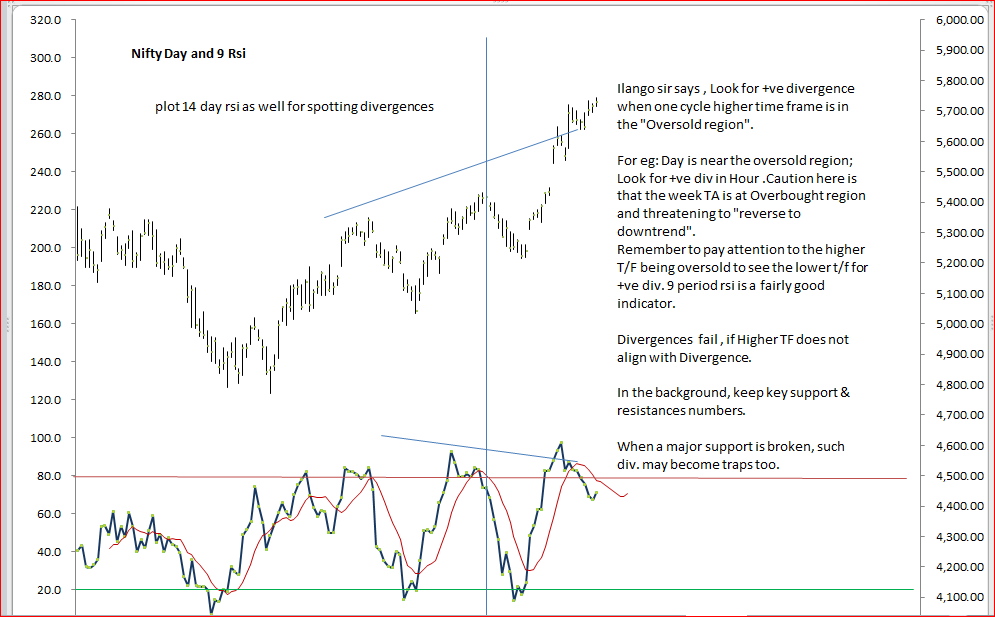
Let me start with 9 RSI day chart .. where I see the -ve divergence has formed well and showed its effects today .
Macd Histogram divergence
But again we have closed at 5747, above 5 day ema at 5735 .
Trend still intact , though momentum is not there now , with a close below day high ema .
Safe shorts would be only below a close of 5 dema .
Candle pattern wise we have a Bearish Engulfing today , which is there after a good uptrend along with weakening of momentum . Candle formed today engulfs the shadow also ,
Confirmation in the form of further weakness needed on Monday . On day charts SS has not crossed the trigger line yet , with a cross of trigger line , shorts would be safer.
Probably it may come with a close below 5 day ema .
Retracements for todays fall from 5810 to 5706 are
| From |
To |
Fall/ Rise |
0.236% |
0.38 |
0.50 |
0.618% |
0.736% |
0.80% |
| 5810 |
5706 |
104 |
5,731 |
5,746 |
5,758 |
5,770 |
5,783 |
5,789 |
Prices going above 80% would mean strength ...
we have done close to 50 % today at 5758.
All in all ,
A bearish engulfing + losing momentum on Day TF + -ve divergnece persisting on day charts .