This is my trading file to organise and jot down my take on the market .I do Technical Analysis. This blog is to keep track of my baby steps so that I can look back at my journey .Looking back tells me how far I have come from days when I knew nothing and can go further .It gives me motivation to keep going on even when I am tired. One has to back up trading with their own studies. The charts I post here are 99% inspired from Ilango sir.


Sunday, 26 August 2012

27 August 2012


Day and Hour Channels ,

Still  well within the day channel, Hour channel is broken ,
last falls from 5246 -5165 was 81 points , from 5378-5294 was of 84 points and from high of 5448 we have already done a fall of 77 points till 5371 anything more than 5364 downside  ( 5448-84) means the falls would be deeper .
 Also 80% of last rise comes to 5363 ,and  break of 80% warns you of more downside..new lows . Last low before we turned up was 5341.

 If prices take support at 5360-5370 zone , then HH is possible  , taking into consideration that day channel is yet intact and the bottom of channel  is far from where prices are trading now .

Thursday, 23 August 2012

EOD 23rd August

Retracement for the fall from 5448 to 5394  comes at

From To Fall/ Rise 0.00236 0.38 0.5 0.00618 0.00736 0.008
5448 5394 54 5406.744 5414.52 5421 5427.383 5433.744 5437.2

We have done 5419 already today close to 50% .

Day Trend is up having lost the momentum with today's close below high ema .
and Hour trend has turned down today withour momentum , as we closed above low ema.

on Hour TF 5 and 10 ema at 5419 , I will keep my eye on this .

Today's low 5394 , if we break this more weakness according to me .
5398 day ema
5371 day low ema

-ve divergence still persisting .

anything above 5438 means HH .
 

Wednesday, 22 August 2012

EW from 5033-5433


EW folks pls write your inputs .

Trend :

Hour trend is down without momentum  .
Day trend is up with Day high ema at 5407 and a close above it at 5413.

Owing to
  • -ve divergence and
  • ew looks to have completed wave3 today at 5433 and possibility of 4th down now
 I will look for weakness to short, First indication would be a close below hour low ema ( 5407) which is also day high ema.. retracement of last rise from 5342 to 5433 comes as
 From   To   Fall/ Rise  0.236%        0.38        0.50 0.618% 0.736% 0.80%
5342 5433        (91)    5,412    5,398    5,388    5,377      5,366      5,360


Day EW chart.


Tuesday, 21 August 2012

EOD 21st August.


Hour charts are continuing to show -ve divergence

Likewise day charts also are continously showing -ve divergence  .

But my HI lo system says a buy at 10:00 on hour charts  today morning with a close above hour high ema , 34 MA( 30 mins ) with 20 points SL.
If you feel that was risky , then buying on break of 5400 could have also worked today .

The Day trend is up with momentum with a close above Day high ema ,

and the Hour trend is also up with momentum with a close above Hour high ema.
I have no positions as of now .
If divergence has to play out , it will indicate by closing below hour high ( 5409) and then a close below 5 hour ema (5404) , untill then its a buy.
5393 is Hour low ema and Day high ema .


Thursday, 16 August 2012

EOD 16th august 2012

Close 5363

HHema 5376
5Hema 5367
Hlema 5360.

Hour trend is down

DHema 5366
5Dema 5348
Dlema 5322.

Day trend is UP...
We have closed below day high ema , suggesting correction may continue till 5348 , anything more would be weakness,

For looking to take a long : prices should not fall beyond 5360-20 = 5340 lvls,  I will watch for prices to close above 5367.

For shorts , If prices close below 5Dema ( 5348) and they might continue to correct further till DLema.


-ve divergence persisting in both hour charts and day charts . ( shows bearish possibility)


Channels ;

While the hour channel was broken , day channel holds .( shows bullish possibility)

Either day channel gets broken or the divergence negates .

Tomorow being friday , week trend should be taken into consideration which is clearly Up presently. 5319 being WHema.


Wednesday, 15 August 2012

Some more channels

Some more channels added to the hour chart . The red one and Blk one ..


Also there is this chart which is showing all the emas are allinged in a bullish way , and my eyes are seeing a fast rise with 20 and 50 moving average .But this view does not match with -ve divergence and resistance ahead at 5400-5410 lvls.

Tuesday, 14 August 2012

EOD 14thAugust2012


EOD 14th August

First thing I notice is the  -ve divergence in hour and day charts ...
Day chart .

 Hour Chart .

Close Price :5380.35
With this
Hour trend is Up , Day Trend is Up with momentum
HHema ( 5378)
DHema ( 5354)

One should wait for the -ve divergence to play out , as we closed above high emas.
Hour Channels

---------------------------------------------------------

Intraday 14-8-12
from 5294 looks like 5 wave up .
w1 5294-5330=36
w2 as flat
a 5330-5311=19
b 5311-5330=19
c 5330-5309=21
w3 =47
i 5309-5326=17
ii 5326-5316=10
iii 5316-5352=36
iv 5352-5337=15

v 5337-5356=19
w4
5356-5330=26
w5 is on
5330-5387=57

Looks like w5 is done at 5387 and now retracement of move from 5294-5387 is on Provided 5387 is not broken .


Saturday, 11 August 2012

Obervations for 13 Aug 2012

Close Price : 5320

TA supporting downmove :

Moving Average:
Hour TF we have closed above 5 ema , but below HH ema ( 5328)
Day TF we have closed above 5 ema ( 5308) , but below DHema ( 5331) bringing sell on rises .

-ve Divergence is seen in day charts

TA supporting upmove.

Thursday, 9 August 2012

Aug 10 2012

Hour trend down with a close below 5331 ( H5ema)
We have closed below Dhigh ema(5331) , day 5ema being 5302 , opening below the DHema / P would suggest possibility of prices going to 5302 .
on hour chart 5-10 bear cross also happened today at 14:00 hours.

EW wise Day Chart


Hour chart


tomorow we see which probability plays out wave 3 or a flat.
----------------------------------------------------------------------------------------
Intraday Aug 10th 2012

Above is 5 mins nifty chart ,As long as trading below the black TL , no longs only on break of this TL one can take a trade.

Here is the day chart .


Thursday, 26 July 2012

EOD 26th July

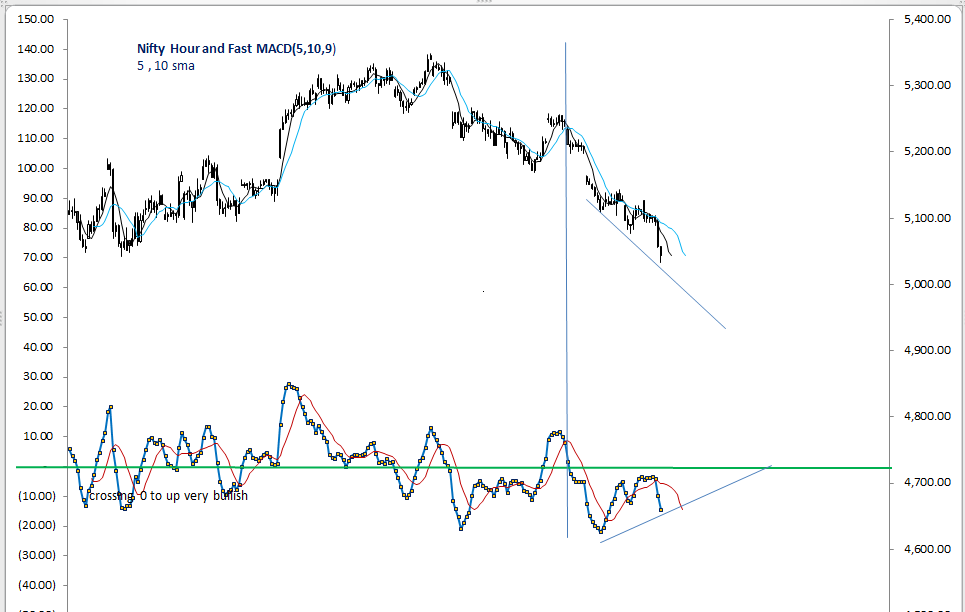
After a week I could see the charts and first thing I notice is the +ve divergence in the hour charts ..

I could not work on EW ...

Hour low ema( 5065) Watch out on close above hour low ema  then hour ema (5072) for the positive divergence to play out.