This is my trading file to organise and jot down my take on the market .I do Technical Analysis. This blog is to keep track of my baby steps so that I can look back at my journey .Looking back tells me how far I have come from days when I knew nothing and can go further .It gives me motivation to keep going on even when I am tired. One has to back up trading with their own studies. The charts I post here are 99% inspired from Ilango sir.


Thursday, 9 August 2012

Aug 10 2012

Hour trend down with a close below 5331 ( H5ema)
We have closed below Dhigh ema(5331) , day 5ema being 5302 , opening below the DHema / P would suggest possibility of prices going to 5302 .
on hour chart 5-10 bear cross also happened today at 14:00 hours.

EW wise Day Chart


Hour chart


tomorow we see which probability plays out wave 3 or a flat.
----------------------------------------------------------------------------------------
Intraday Aug 10th 2012

Above is 5 mins nifty chart ,As long as trading below the black TL , no longs only on break of this TL one can take a trade.

Here is the day chart .


Thursday, 26 July 2012

EOD 26th July

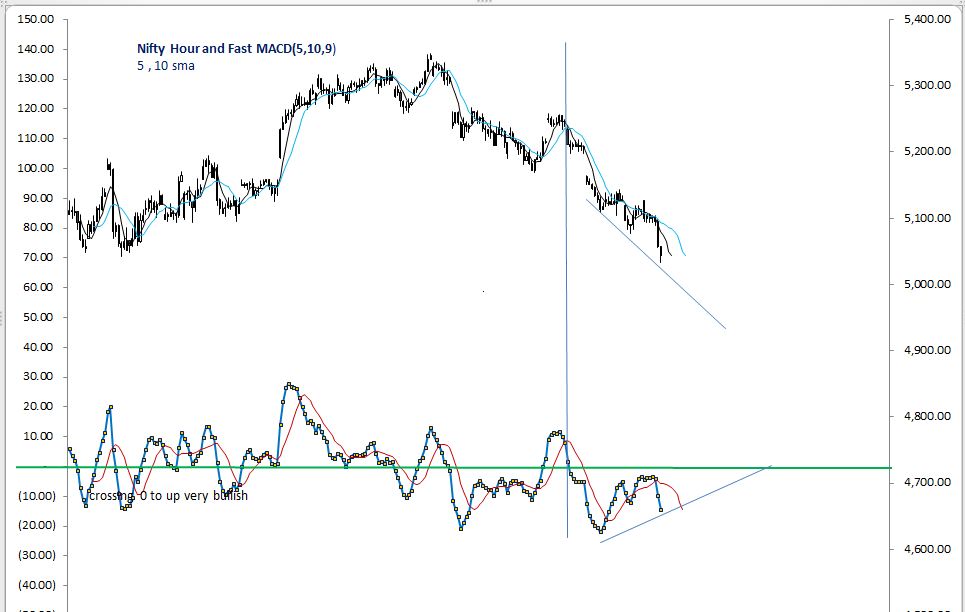
After a week I could see the charts and first thing I notice is the +ve divergence in the hour charts ..

I could not work on EW ...

Hour low ema( 5065) Watch out on close above hour low ema  then hour ema (5072) for the positive divergence to play out.

Tuesday, 17 July 2012

EOD 17th July

We are trading with in the channel drawn  . Breakout above will be a buy , one has to wait for that.

Day TA ,, hour TA trend is down ...

Hour TF says
HH ema ( 5210)
34 Ema on 30 mins TF ( 5218) .
5ema (5200)
10ema(5208)


IF we break the black TL tomorow then idea of long gets thrashed . 5160/5140/5125 comes as next support.
 So UP it is , If we hold 5210 . Break out of falling TL ( green) with volumes .
And break of low today ( 5182-5180) takes us to support of 5160 and may be further down .

 I see +ve divergence in hour charts , prices have to confirm by breaking the channel top ( Green channel ) As seen in the above chart

For going Long :
As and when this 5-10 cross over takes place , my eyes will be on close above HHema and holding of close ema /Low ema on hour TF .

Saturday, 14 July 2012

Another Break

Break from trading yet again , due to health problems ...
Hope to be back very soon !

Jai Maa Durga.

Thursday, 12 July 2012

Trade plan for 12th July

So we open gap down , courtesy  the bearish candle pattern formed yesterday .

We made a low of 5234 and are maintaining that till 10 close ,
i have drawn a TL from the high today at 5262  , as and when we break this TL , along with ema crossover of 13-34 ,I will enter longs with day low as SL.
***********************************************************

Update at 12:30 Crossover on 5 mins charts never happened , and day low broken .This break did not give chance to enter as 2 mins candle shows high ( 5240) and low ( 5227). Trading below day low ema so downward momentum in on bringing lot of weakness in prices ...
Rising wedge , bearish "harmami" , all working together .

Stepping out for the rest of the day .......

Wednesday, 11 July 2012

Observations for 12th July

and a close up


We have formed a bearish " Harami" very close to the major resistance of 5343 lvls , as seen in the EOD chart . All possibilities that we are very close to  breaking the lower yellow TL and head down.
Todays day low was 5300...anything below this means Shorts it is .

Tuesday, 10 July 2012

EOD 10th July

We started with a positive note today morning with open above yesterday's close .
At 10 :00 with a close above HHema , it indicated momentum is Up in hour TF . At 12:00 With a break of yesterday's high and 5 - 10 hr ema cross over  , buy signal generated for the day. Which gave good returns.

Channel is intact as seen in the day and hour charts below


Monday, 9 July 2012

EOD 9th July

We opened below the TL mentioned in last post and also yesterday's low making the bias for the day -ve. Making a dip to Blk TL possible as  mentioned in yesterday's post  .


.Also at 10:00 hour TA was poised as
Here 5 - 10 Cross over happned along with a close below hour low ema . Increasing the Possibilities of prices going down .

Now with todays close weakness in hour TF has spread over to Day TF with a close below 5  Day ema  . 5261 is day low ema which was support today , if we break this then Downward momentum will pick ...and we may see prices touching the Lower red TL as seen in te hour chart.

In very simple way ,
If we open above the blk TL seen in the hour chart , bias will be UP and if we open below it or break it then bias will be down probably to touch  red TL.
Presently HOur TA down and momentum missing , Day TA turned down but momentum missing .